Five years ago, on October 14, I launched TKer, the newsletter that tells the story of how the stock market usually goes up.
📉 That first year was highlighted by a bear market as the Federal Reserve went to war against inflation. The S&P 500 fell 19%.
📈 Year two brought an impressive stock market rebound. It began two days after the current bull market started. That year, the S&P ended up 21% higher despite lingering uncertainty.
📈 Year three extended the rally, with the S&P surging an incredible 35%. Interestingly, the average annualized return since TKer’s launch up to that point was an extraordinarily average 9%.
📈 Year four brought political upheaval after the U.S. presidential election, trade wars sparked by new tariffs, volatility in interest rates and currency markets, heightened geopolitical tensions, threats to Federal Reserve independence, and a government shutdown, which added to concerns about the quality of economic data. Yet the stock market repeatedly set new all-time highs, climbing 14% during the period — arguably because earnings were resilient.
📈 Year five saw many of year four’s challenges linger. But one key difference was that the forward price-to-earnings (P/E) ratio was unusually elevated at close to 23x, the highest level since 2020.
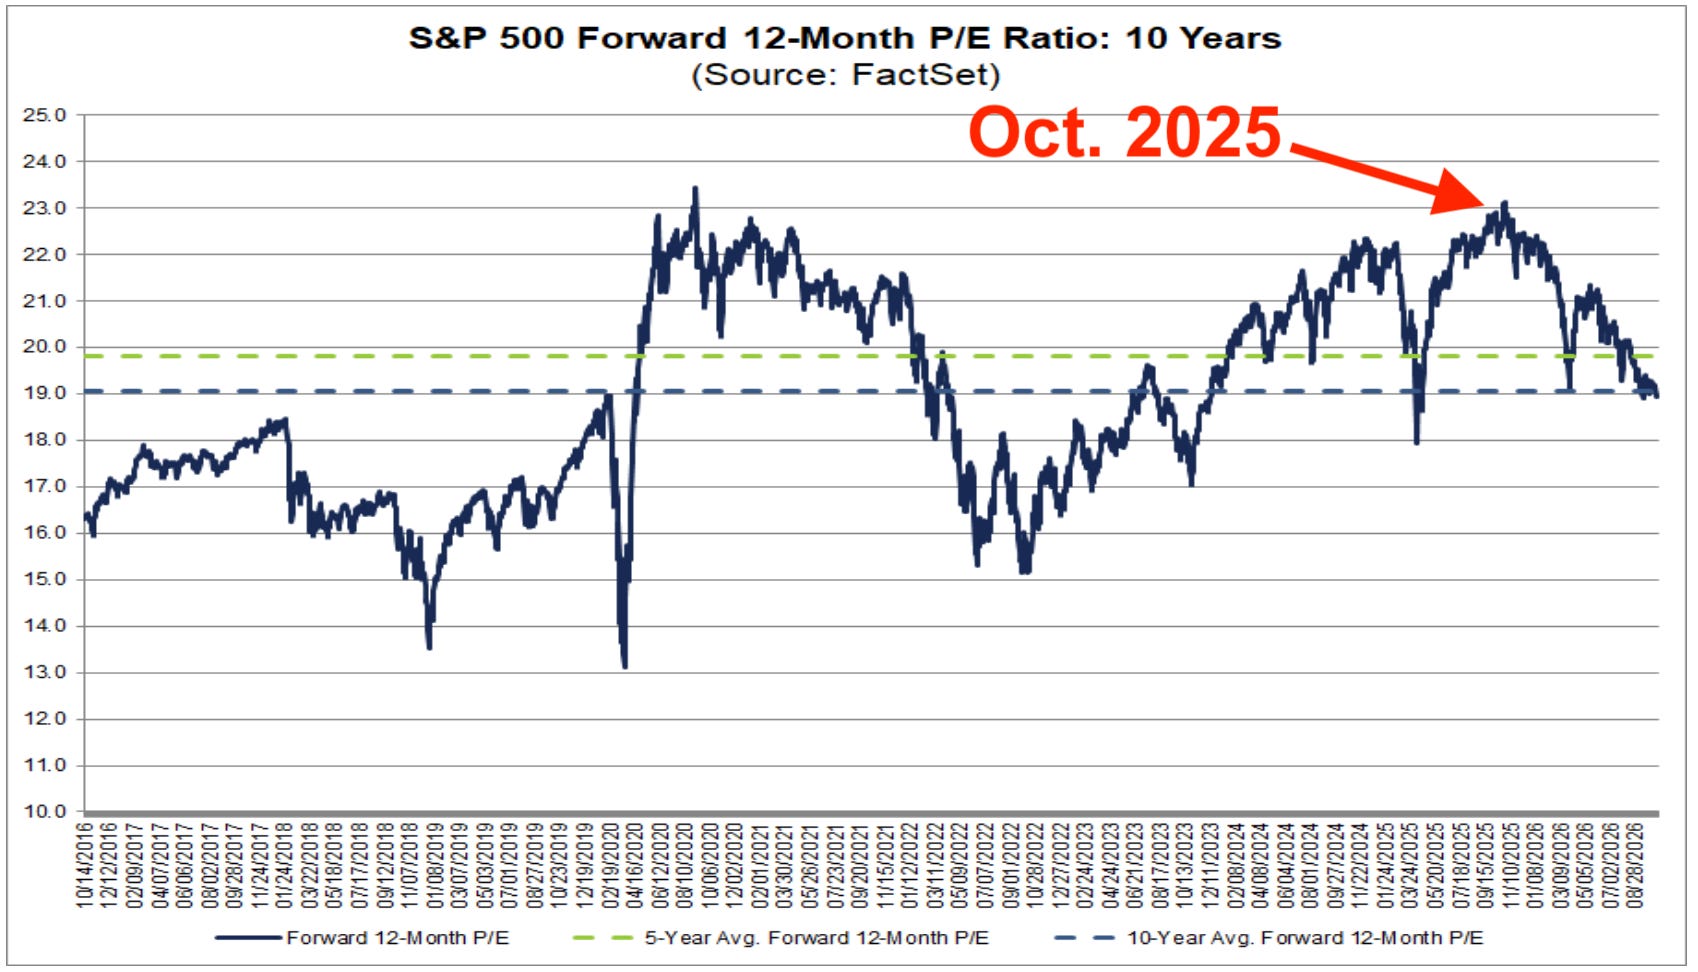
In other words, stocks looked expensive when I published my previous annual update.
But as we’ve discussed for years, elevated valuations don’t mean prices are likely to fall soon. We were reminded of this in TKer’s fifth year as the S&P 500 climbed 16%.
About a year ago, some of Wall Street’s most prominent strategists made a bold prediction: High valuations were justified, and they’ll remain elevated in 2026 as stock prices go higher.
Others argued valuations were a headwind and at risk of contracting, capping price returns.
I’ve written before that P/E ratio forecasts are where Wall Street’s year-end price target calculations often go wrong, mostly because the direction of the ratio is hard to predict over short periods.
But ten months into 2026, P/E ratios have been contracting. Does that mean the bulls were wrong and the skeptics were right?
Sort of, but also not really.
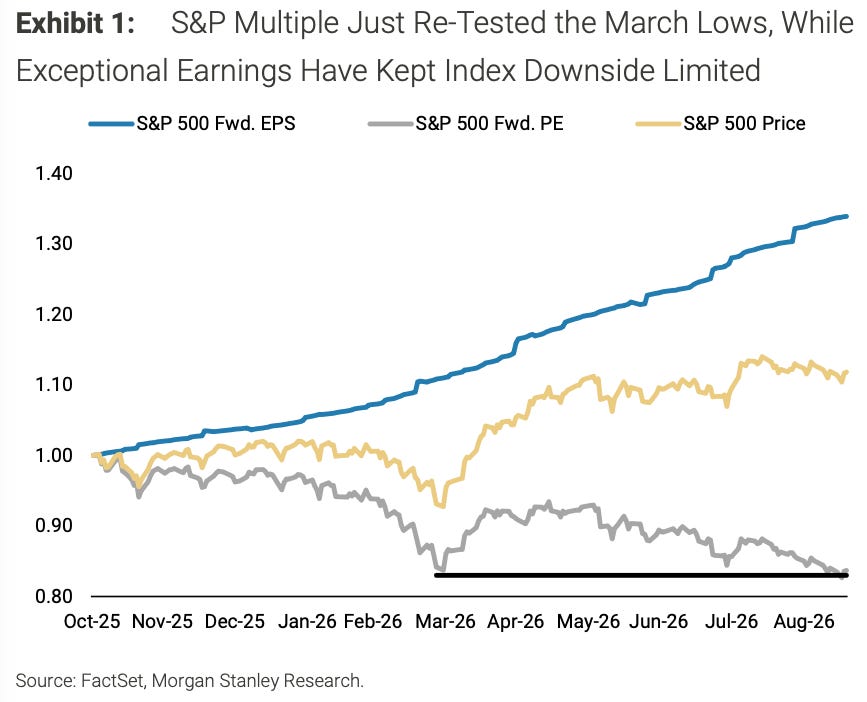
One of this year’s defining market stories has been the aggressive, ongoing upward revisions to earnings forecasts, which have pulled P/E ratios down. This occurred even as stock prices trended higher. Fractions 101: If the denominator (E) rises faster than the numerator (P), then the P/E falls.
This brings us to TKer Stock Market Truth No. 6:
6. Valuations won’t tell you much about next year
There are many valuation methods that’ll help you estimate whether a stock or stock market is cheap or expensive. We won’t go through all of those here.
While valuation methods may tell you something about long-term returns, most tell you almost nothing about where prices are headed in the next 12 months. Over short periods like this, expensive things can get more expensive and cheap things can get cheaper.
It’s worth noting that prices can be cheap or expensive for extended periods of time. In fact, some folks would argue valuations are not mean-reverting.
Expensive stocks often get more expensive. Cheap stocks often get cheaper.
And sometimes prices fall as stocks get more expensive, and prices rise as they get cheaper.
Trading the stock market can be hard. You could’ve been absolutely right if you predicted P/E ratios would contract. But if you used that information to sell stocks, you might’ve made a huge mistake.
This past year’s highlights include being quoted in Barron’s weekend magazine, speaking on a panel at Odd Lots Live, appearing on The Compound and Friends, and presenting at the Money Show in Las Vegas, where I also won the conference poker tournament!
TKer’s message continues to resonate with a growing audience.
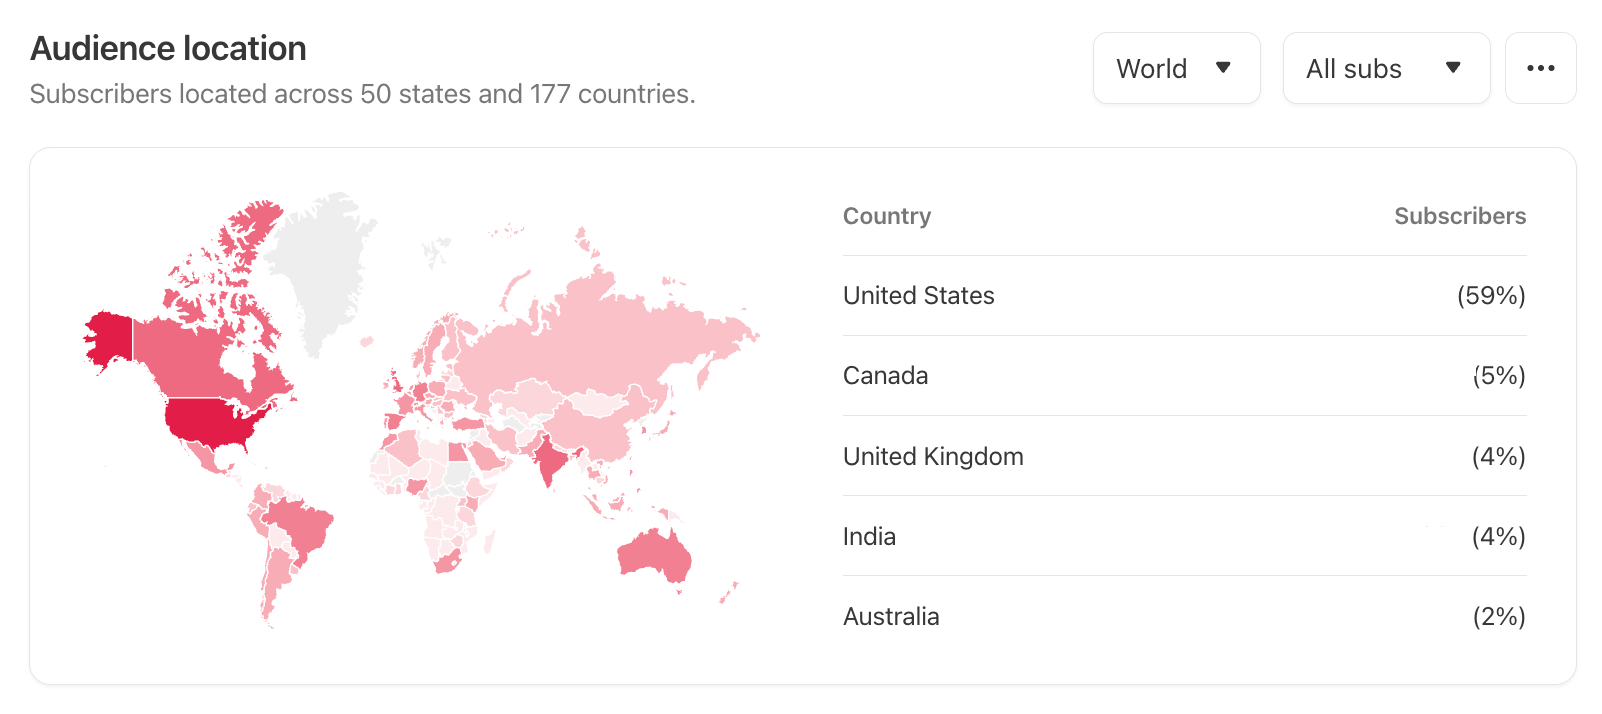
More than 36,000 subscribers are receiving TKer newsletters in their inboxes. TKer is read across all 50 states and in 177 countries.
Paid subscription revenue hit a record high in July, but growth has since plateaued. This isn’t surprising, given the stock market has traded near record levels for months. As I’ve written before, reader interest tends to be highest during market downturns and volatile periods.
I continue to receive great suggestions on how to boost growth by improving the reader experience, and I’ve implemented some of them. But one thing I won’t do is adjust the content strategy for the sake of growth if it means compromising what readers value about TKer.
What I care about most is that I have the right readers, including curious long-term investors, experienced Wall Street professionals, independent financial advisors, markets reporters, and many other individuals who can appreciate that the stock market usually goes up.
Thank you for your support! I’m especially grateful for you paid subscribers. TKer is a reader-supported small business, so paid subscriptions keep me going.
If you’re a free subscriber and you find value in TKer, please consider upgrading to a paid subscription!
–
Related from TKer:
📉The stock market fell last week, with the S&P 500 shedding 1.9% to end at 7,659.44. The index is now down 2.0% from its October 6 closing high of 7,818.93 and up 14.1% year-to-date. For market insights, check out the Stock Market tab at TKer. »
There were several notable data points and macroeconomic developments since our last review:
🏦 America’s top banks confirm that the economy remains resilient, but uncertainty is up: From JPMorgan’s Jamie Dimon: “The U.S. economy continued to be fueled by strong business investment and ongoing consumer spending. However, large fiscal deficits, sticky inflation, elevated asset prices, rising interest rates and geopolitical conditions continue to shift under the surface. These forces may be manageable, but we remain prepared for a wide range of outcomes.”
Here’s Wells Fargo’s Charlie Scharf: “While economic uncertainty exists and consumer sentiment remains mixed, our data shows that our consumer and business customers are doing well. Consumers are spending more, loan delinquencies are low, and deposit and investment balances have grown. Businesses continue to have strong balance sheets and losses remain low. While higher interest rates, higher oil prices and persistent inflation create risks to the economy, strong positive forces such as the investment in AI infrastructure, high employment levels and consistent wage growth continue to outweigh the risks.”
And Citi’s Jane Fraser: “In the U.S., whilst much has been made of the AI boom, the consumer is still driving much of the growth, the labor market is stable, and companies remain active. Our near-term economic outlook remains positive.“
🎈Consumer price inflation heated up. The Consumer Price Index (CPI) increased 3.7% year-over-year in September, up from 3.4% in the prior month. Adjusted for food and energy, core CPI rose 2.6, up from 2.4%.
Month over month, CPI rose 0.6% as energy prices jumped 5.2%. Core CPI was up 0.3%. If you annualize the three-month and six-month figures — a reflection of the short-term trend in prices — core CPI climbed 3.4% and 2.9%, respectively.
For more discussion on inflation and monetary policy, read: The other side of the Fed’s inflation ‘mistake’ 🧐 and ‘When will the Fed cut rates?’ is not the right question for investors right now ✂️
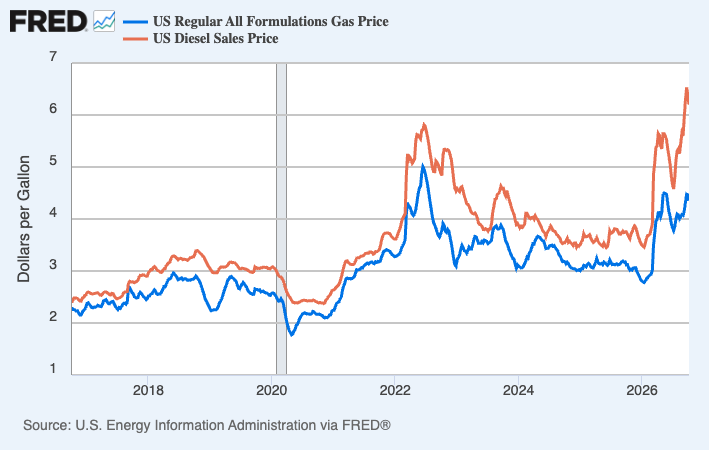
⛽️ Gas prices tick lower, but remain high. From AAA: “The national average for a gallon of regular gasoline is down a couple of cents from last week at $4.33. Gas prices aren’t budging much as crude oil prices remain high, once again nearing $100 per barrel. The national average has stayed above $4 per gallon since late July and is currently more than a dollar higher than it was this time last year. As the graph below shows, the fall months typically bring lower gas prices, but volatility in the oil market has led to seasonal record highs this year. “
Here’s a longer-term look at gas and diesel price trends, as tracked by the EIA.
For more on energy prices, read: Our love-hate relationship with rising oil prices in charts 💔🛢️📊
🛍️ Retail shopping activity rose to record levels. Retail sales rose 0.8% in September to a record $745 billion. Gas station sales jumped 6.2% as energy prices heat up.
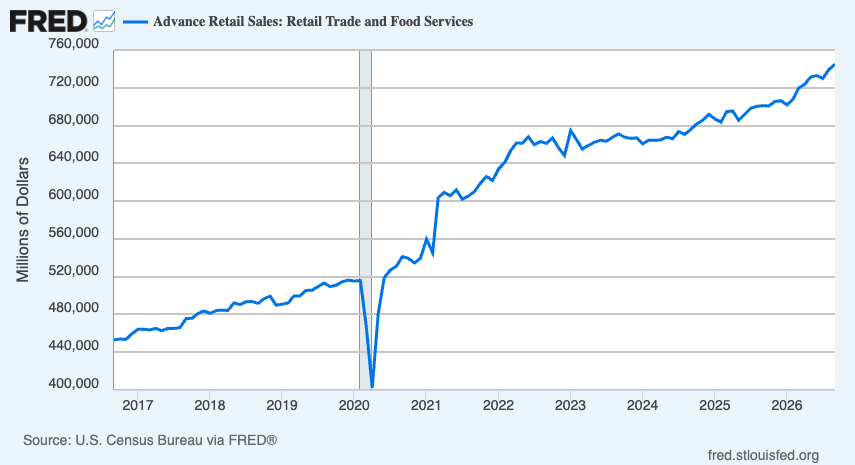
Excluding autos and gas, which tend to be short-term volatile, retail sales rose 0.2%.
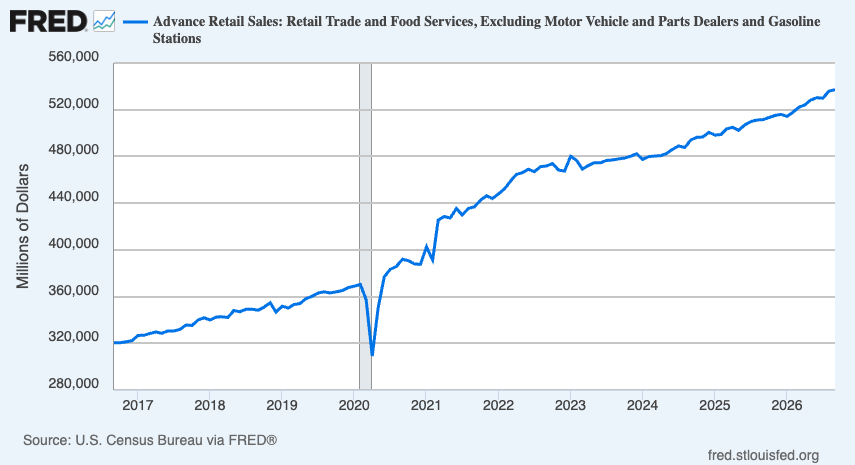
Here’s how retail sales changed by category.
💳 Card spending data is holding up. From BofA: “Total card spending per HH was up 5.1% y/y in the week ending Oct 10, according to BAC aggregated credit and debit card data. Hurricane Isaias’s impact was limited to some sectors like restaurants in the South. Overall, spending remains healthy. Lower-income spending growth has consistently outpaced higher-income spending growth over the past several weeks.”
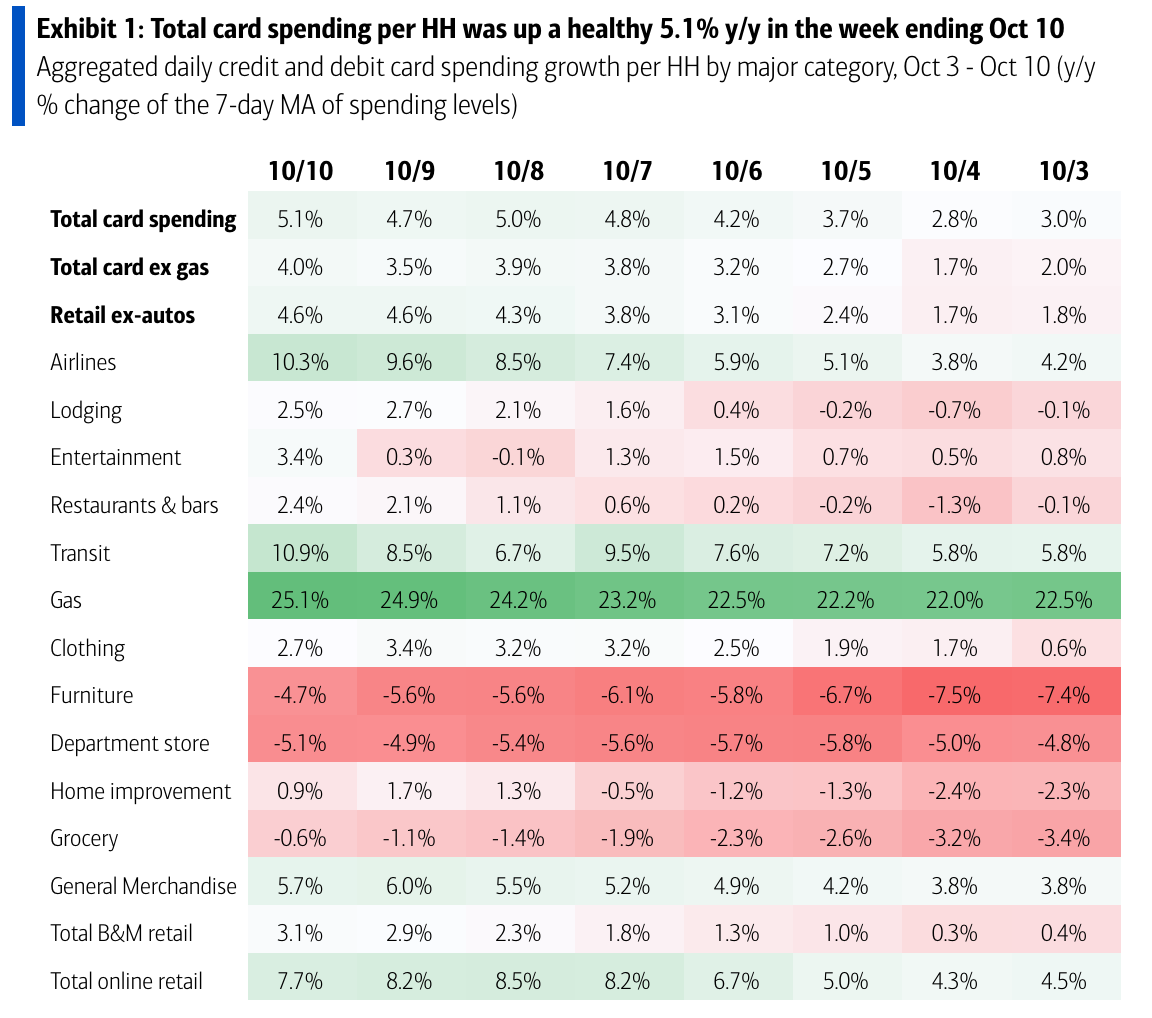
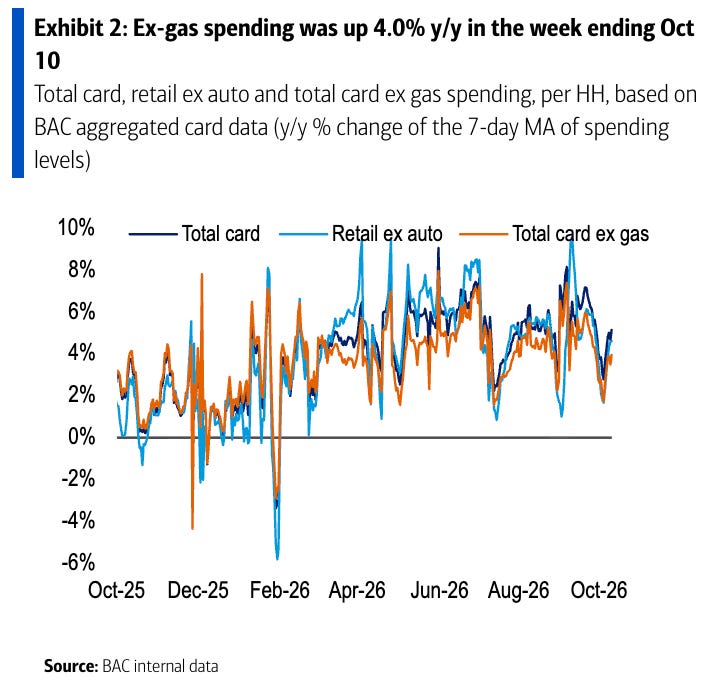
Consumer spending data has looked a lot better than consumer sentiment readings. For more on this contradiction, read: We’re taking that vacation whether we like it or not 🛫 and Household finances are both ‘worse’ and ‘good’ 🌦️
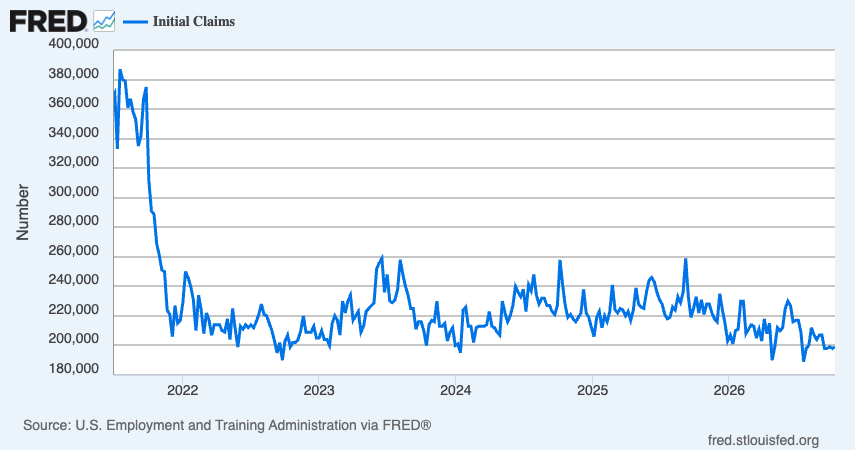
💼 New unemployment insurance claims, total ongoing claims remain low. Initial claims for unemployment benefits ticked up to 199,000 during the week ending Oct. 10, up from 198,000 the week prior. This metric remains at levels historically associated with economic growth.
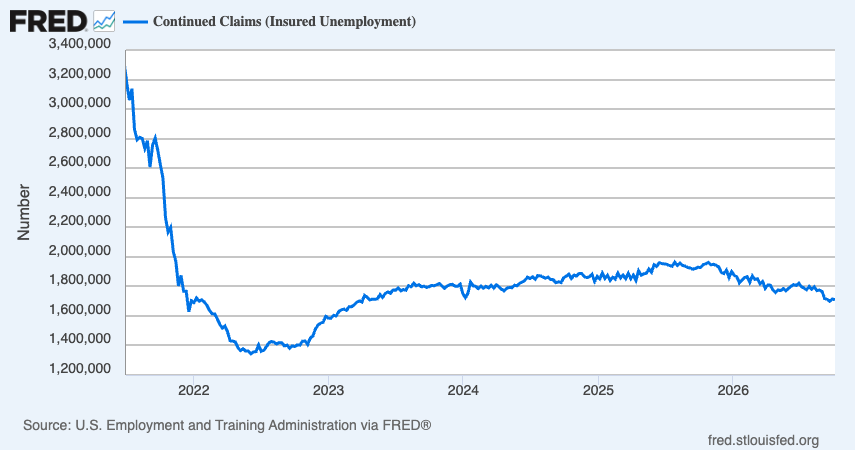
Insured unemployment, which captures those who continue to claim unemployment benefits, ticked down to 1.71 million during the week ending Oct. 3.
For more on the labor market, read: Why mass tech layoffs have little effect on total employment 💾
🤔 Recent private job growth is positive. According to payroll processor ADP, private U.S. employers added 24,750 jobs in the four weeks ending Sept. 26.
For more on the labor market, read: Things are looking up in the labor market 👍
🏠 Mortgage rates remain elevated. According to Freddie Mac, the average 30-year fixed-rate mortgage stood at 7.4%, unchanged from last week. Itr remains at the highest average rate since Nov. 2023.
As of Q2, there were 149.5 million housing units in the U.S., of which 87.0 million were owner-occupied and about 40% were mortgage-free. Of those carrying mortgage debt, almost all have fixed-rate mortgages, and most of those mortgages have rates that were locked in before rates surged from 2021 lows. All of this is to say: Most homeowners are not particularly sensitive to the weekly movements in home prices or mortgage rates.
For more on mortgages and home prices, read: Why home prices and rents are creating all sorts of confusion about inflation 😖
🏚 Home sales rose. Sales of previously owned homes increased 1.5% in September to an annualized rate of 3.99 million units. From NAR chief economist Lawrence Yun: “Despite the small monthly gain on a seasonally adjusted basis, August and September marked the two slowest months for home sales this year. Further increases in mortgage rates in recent weeks mean fewer buyers can qualify to purchase a home.”
On prices, from the NAR: “The median existing-home sales price for all housing types in September was $417,500, up 1.3% from one year ago ($412,300) – the 39th consecutive month of year-over-year price increases.“
👎 Small business optimism deteriorated. The NFIB’s Small Business Optimism Index declined to 97.9 in September, down from 98.7 in August. From the NFIB: “Small business owners are proceeding with caution as they interpret how rising costs, interest rates, and the difficulty in finding qualified employees are impacting their business.”
Keep in mind that during times of perceived stress, soft survey data tends to be more exaggerated than actual hard data.
For more on this, read: What businesses do > what businesses say 🙊 and 4 sometimes-conflicting ways I’m thinking about the economy 😬😞😎🙃
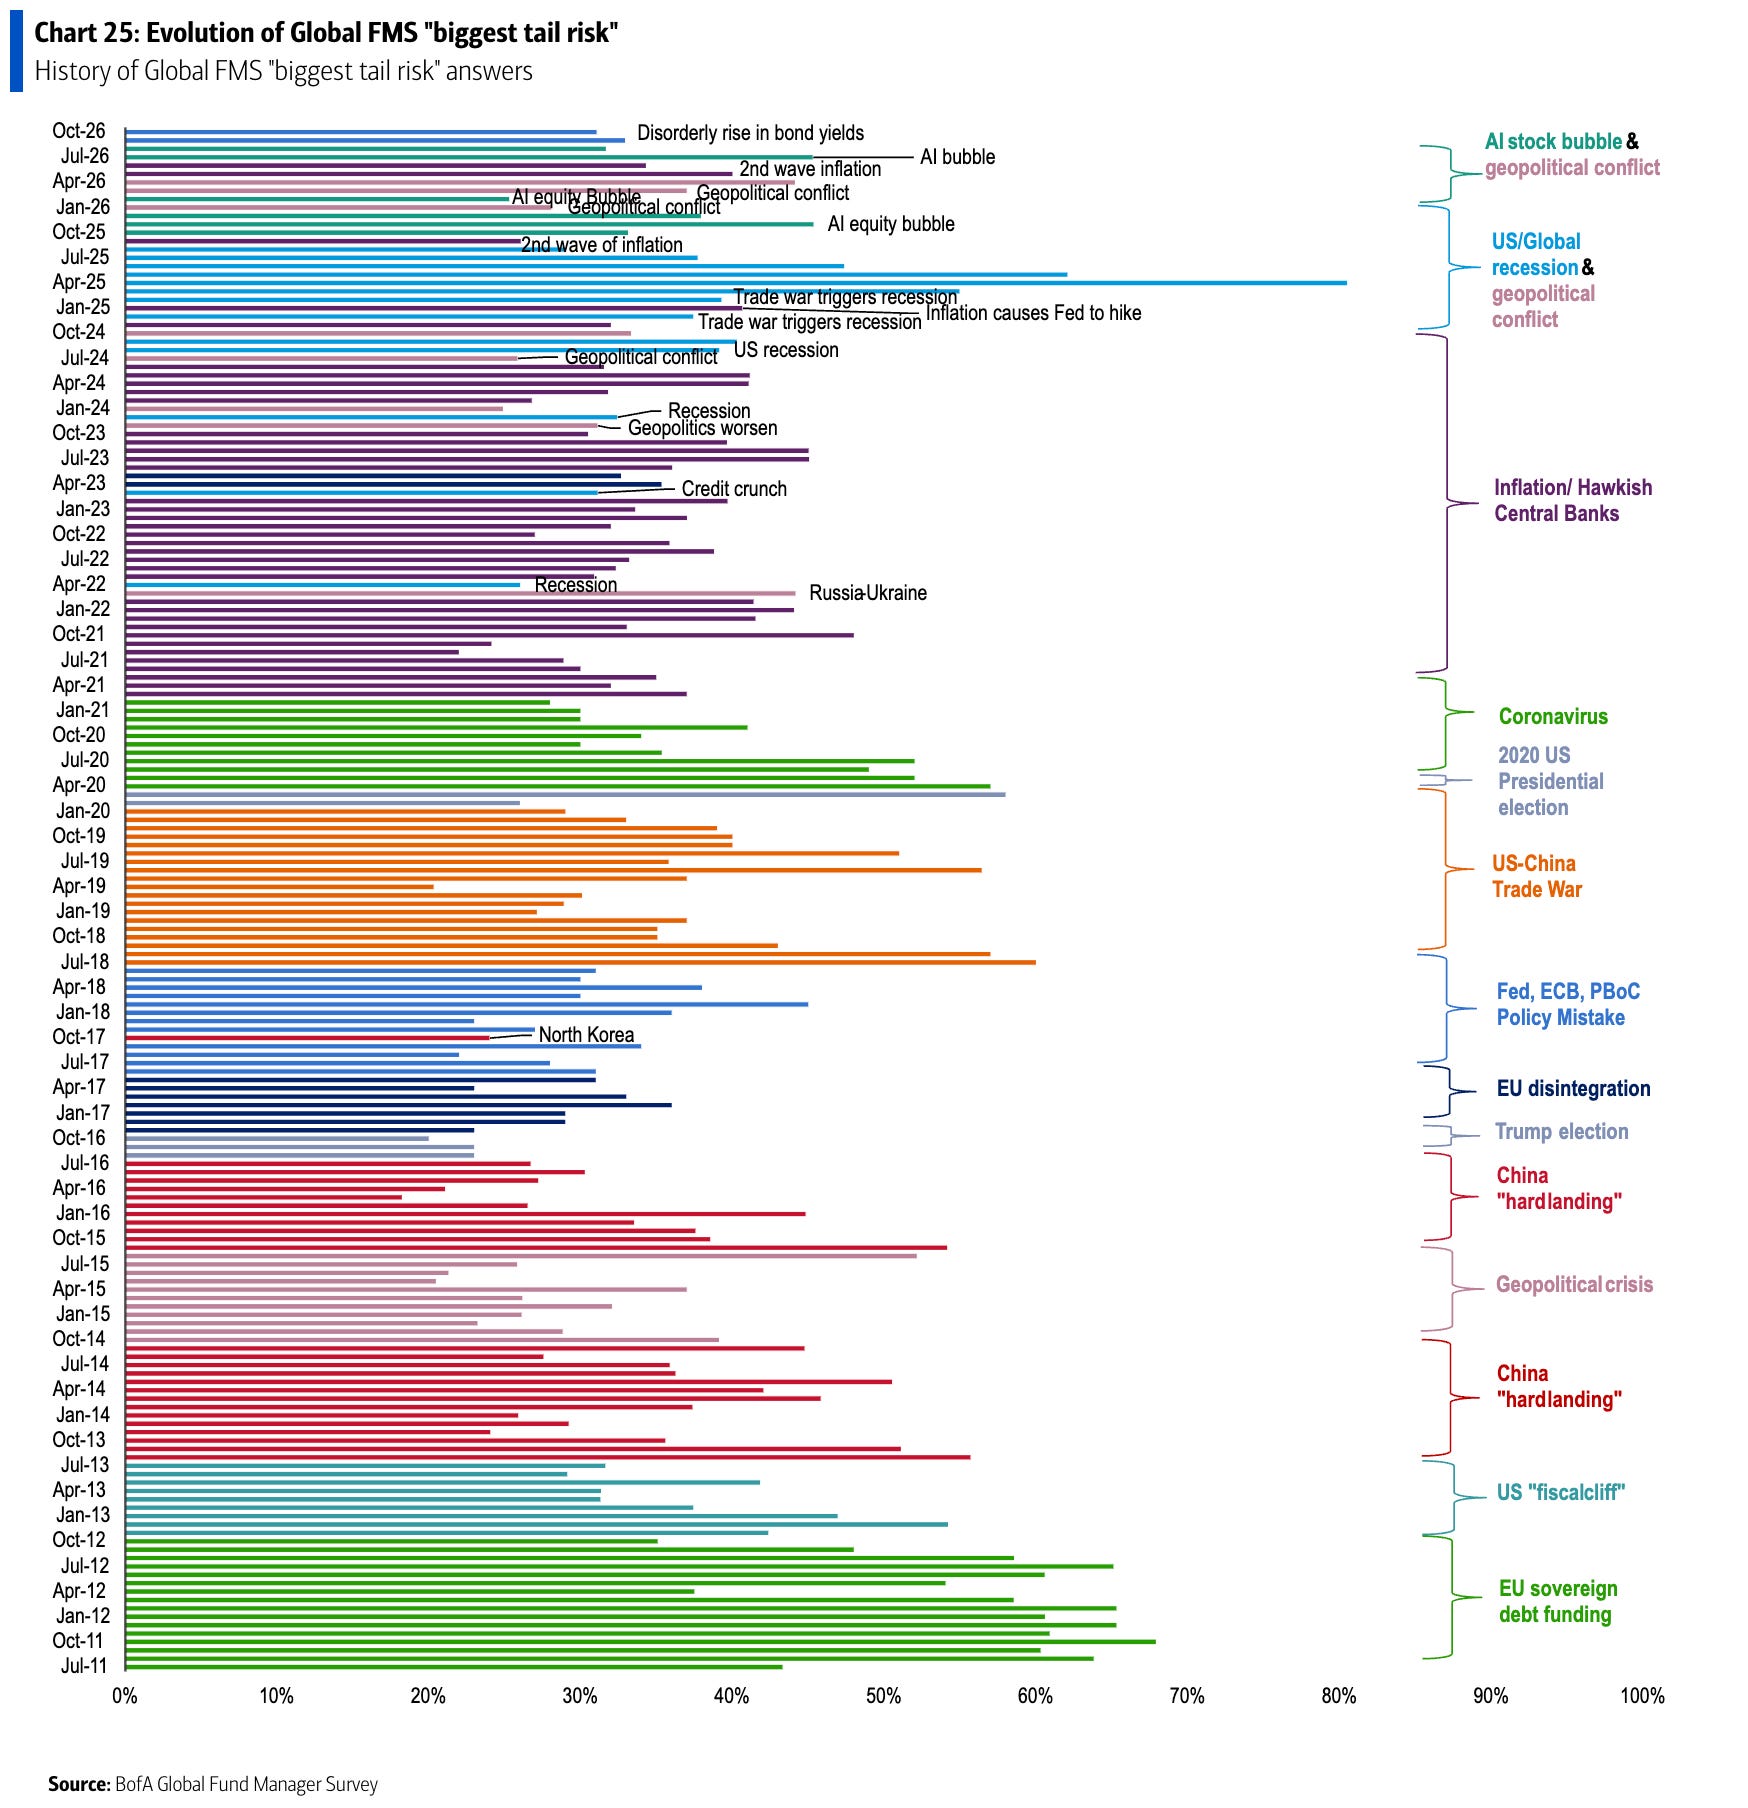
😬 This is the stuff pros are worried about. From BofA’s October Global Fund Manager Survey: “Investors believe that the biggest tail risk to markets is a ‘disorderly rise in bond yields’ (31%), then ‘AI bubble’ (23%), ‘2nd wave of inflation’ (20%), and ‘hyperscaler credit event’ (11%).”
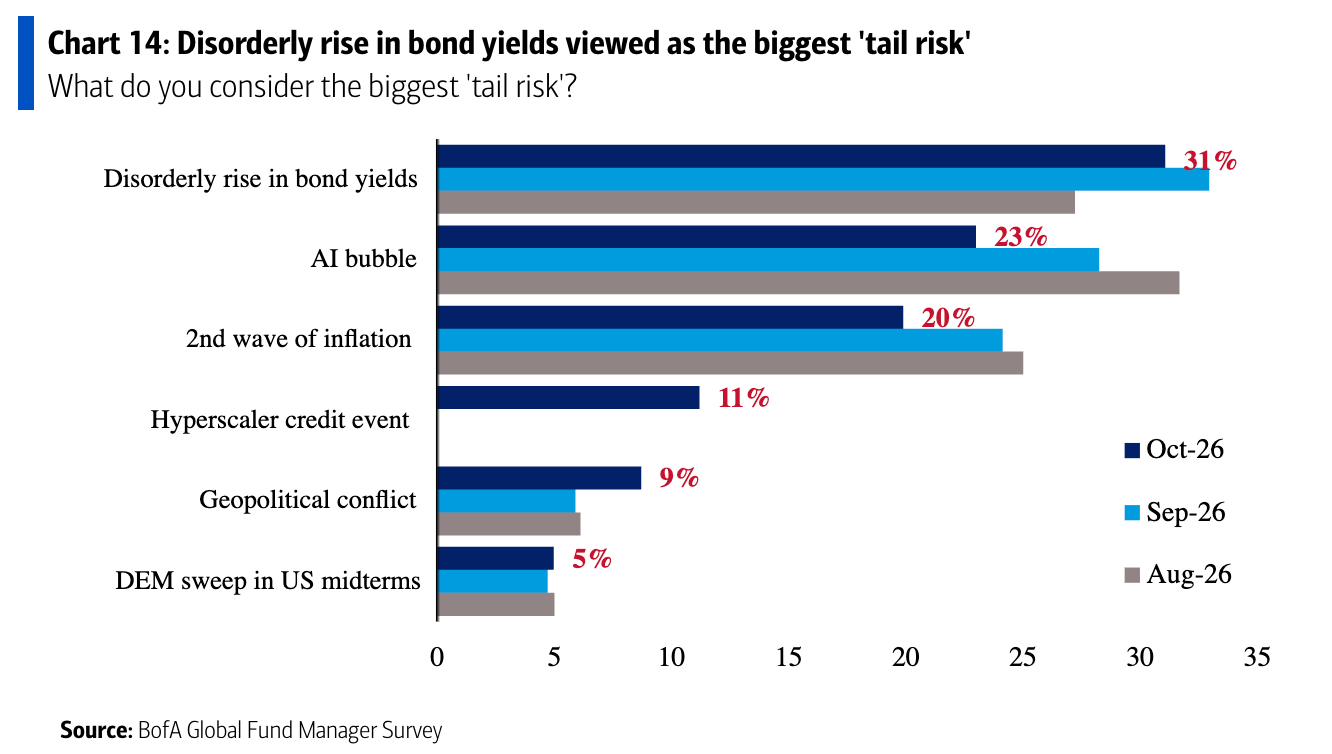
Here’s how the biggest “tail risk” has evolved over the years.
For more on risks, read: Known worries and unknown unknowns 😬 and Two times when uncertainty seemed low and confidence was high 🌈
🛠️ Industrial activity picked up. Industrial production activity in September rose 0.1% from the prior month. Manufacturing output rose 0.3% compared to the prior month.
📈 Near-term GDP growth estimates are tracking positively. The Atlanta Fed’s GDPNow model sees real GDP growth rising at a 3.6% rate in Q3.
For more on GDP and the economy, read: It’s too ambiguous to just say ‘the economy’ 🤦🏻♂️ and Economic data can often be both ‘worse’ and ‘good’ 🌦️
Earnings look bullish: The long-term outlook for the stock market remains favorable, bolstered by expectations for years of earnings growth. And earnings are the most important driver of stock prices.
Demand is positive: Demand for goods and services remains positive, supported by healthy consumer and business balance sheets. Personal spending activity remains at record levels. Core capex orders, which are a leading indicator of business spending, have been trending higher.
Growth rates have cooled: While the economy remains healthy, growth has normalized from much hotter levels earlier in the cycle. The economy is less “coiled” these days as major tailwinds like job openings and excess savings have faded. Job creation, while positive, is not as hot as it used to be. It has become harder to argue that growth is destiny.
Actions speak louder than words: We are in an odd period, as hard economic data has decoupled from soft, sentiment-driven data. Consumer and business sentiment has been relatively poor, even as tangible consumer and business activity continues to grow and trend at record levels. From an investor’s perspective, what matters is that the hard economic data holds up.
Stocks are not the economy: There’s a case to be made that the U.S. stock market could outperform the U.S. economy in the near term, thanks largely to positive operating leverage. Since the pandemic, companies have aggressively adjusted their cost structures. This included strategic layoffs and investment in new equipment, including AI-powered hardware. These moves are driving positive operating leverage, meaning modest sales growth — in the cooling economy — translates into robust earnings growth.
Mind the ever-present risks: We should not get complacent. There will always be risks to worry about, such as U.S. political uncertainty, geopolitical turmoil, energy price volatility, and cyberattacks. There are also the dreaded unknowns. Any of these risks can flare up and spark short-term market volatility.
Investing is never a smooth ride: Economic recessions and bear markets are harsh realities that all long-term investors should expect as they build wealth in the markets. Always keep your stock market seat belts fastened.
Think long-term: For now, there’s no reason to believe the economy and the markets will face a challenge they can’t overcome. The long game remains undefeated, and long-term investors can expect that streak to continue.
For more on how the macro story is evolving, check out the previous review of the macro crosscurrents. »
Here’s a roundup of some of TKer’s most talked-about paid and free newsletters about the stock market. All of the headlines are hyperlinked to the archived pieces.
The stock market can be intimidating: It’s real money on the line, the information is overwhelming, and people can lose fortunes very quickly. But it’s also where thoughtful investors have long accumulated wealth. The main difference between those two outlooks comes down to misconceptions about the stock market that can lead people to make poor investment decisions.
Passive investing usually means buying and holding a fund that tracks an index. And no passive investment strategy has attracted as much attention as buying an S&P 500 index fund. However, the S&P 500 — an index of 500 of the largest U.S. companies — is anything but a static set of 500 stocks.

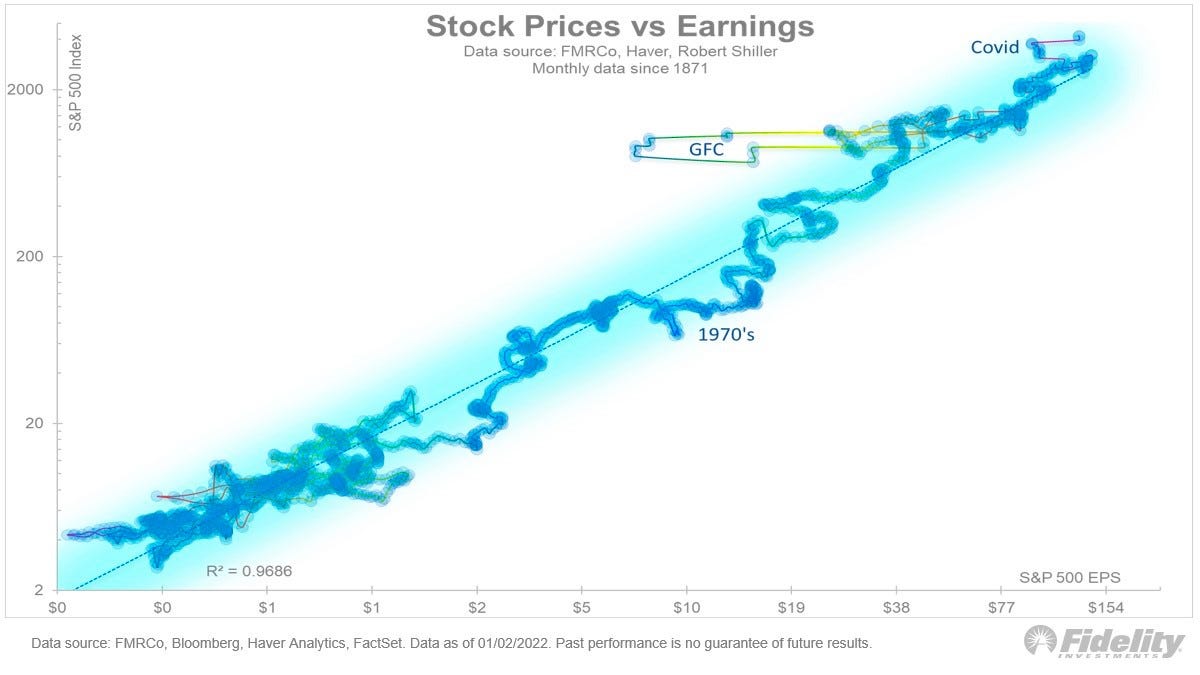
For investors, anything you can ever learn about a company matters only if it also tells you something about earnings. That’s because a stock’s long-term moves can ultimately be explained by the underlying company’s earnings, earnings expectations, and uncertainty about those expectations. Over time, stock prices and earnings have a very tight statistical relationship.
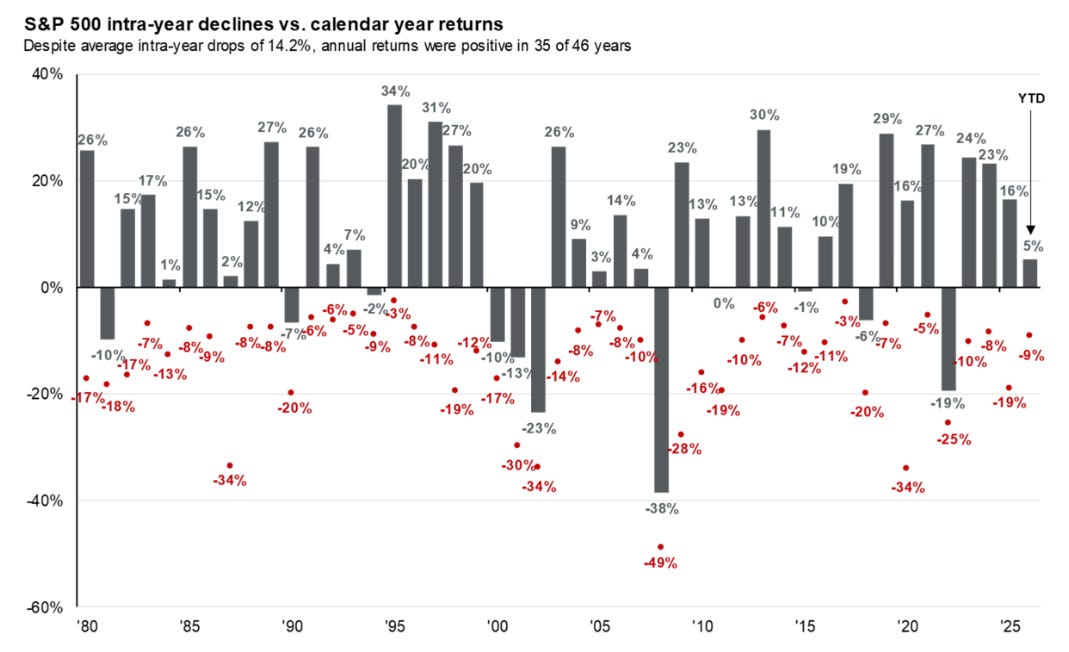
Investors should always be mentally prepared for major stock market sell-offs. It’s part of the deal when you invest in an asset class that is sensitive to the constant flow of good and bad news. Since 1950, the S&P 500 has averaged a max annual drawdown (i.e., the biggest intra-year sell-off) of 14%.
Every recession in history was different. And stock performance around them varied widely. There are two things worth noting. First, recessions have always been accompanied by a significant drawdown in stock prices. Second, the stock market bottomed and inflected upward long before recessions ended.

Since 1928, the S&P 500 has generated a positive total return in more than 89% of five-year periods. Those are pretty good odds. When you extend the timeframe to 20 years, you’ll see that the S&P 500 has never had a period where it didn’t generate a positive return.
While a strong dollar may be great news for Americans vacationing abroad and U.S. businesses importing goods from overseas, it’s a headwind for multinational U.S.-based corporations doing business in non-U.S. markets.

…you don’t want to buy them when earnings are great, because what are they doing when their earnings are great? They go out and expand capacity. Three or four years later, there’s overcapacity and they’re losing money. What about when they’re losing money? Well, then they’ve stopped building capacity. So three or four years later, capacity will have shrunk and their profit margins will be way up. So, you always have to sort of imagine the world the way it’s going to be in 18 to 24 months as opposed to now. If you buy it now, you’re buying into every single fad every single moment. Whereas if you envision the future, you’re trying to imagine how that might be reflected differently in security prices.
Some event will come out of left field, and the market will go down, or the market will go up. Volatility will occur. Markets will continue to have these ups and downs. … Basic corporate profits have grown about 8% a year historically. So, corporate profits double about every nine years. The stock market ought to double about every nine years… The next 500 points, the next 600 points — I don’t know which way they’ll go… They’ll double again in eight or nine years after that. Because profits go up 8% a year, and stocks will follow. That’s all there is to it.
Long ago, Sir Isaac Newton gave us three laws of motion, which were the work of genius. But Sir Isaac’s talents didn’t extend to investing: He lost a bundle in the South Sea Bubble, explaining later, “I can calculate the movement of the stars, but not the madness of men.” If he had not been traumatized by this loss, Sir Isaac might well have gone on to discover the Fourth Law of Motion: For investors as a whole, returns decrease as motion increases.
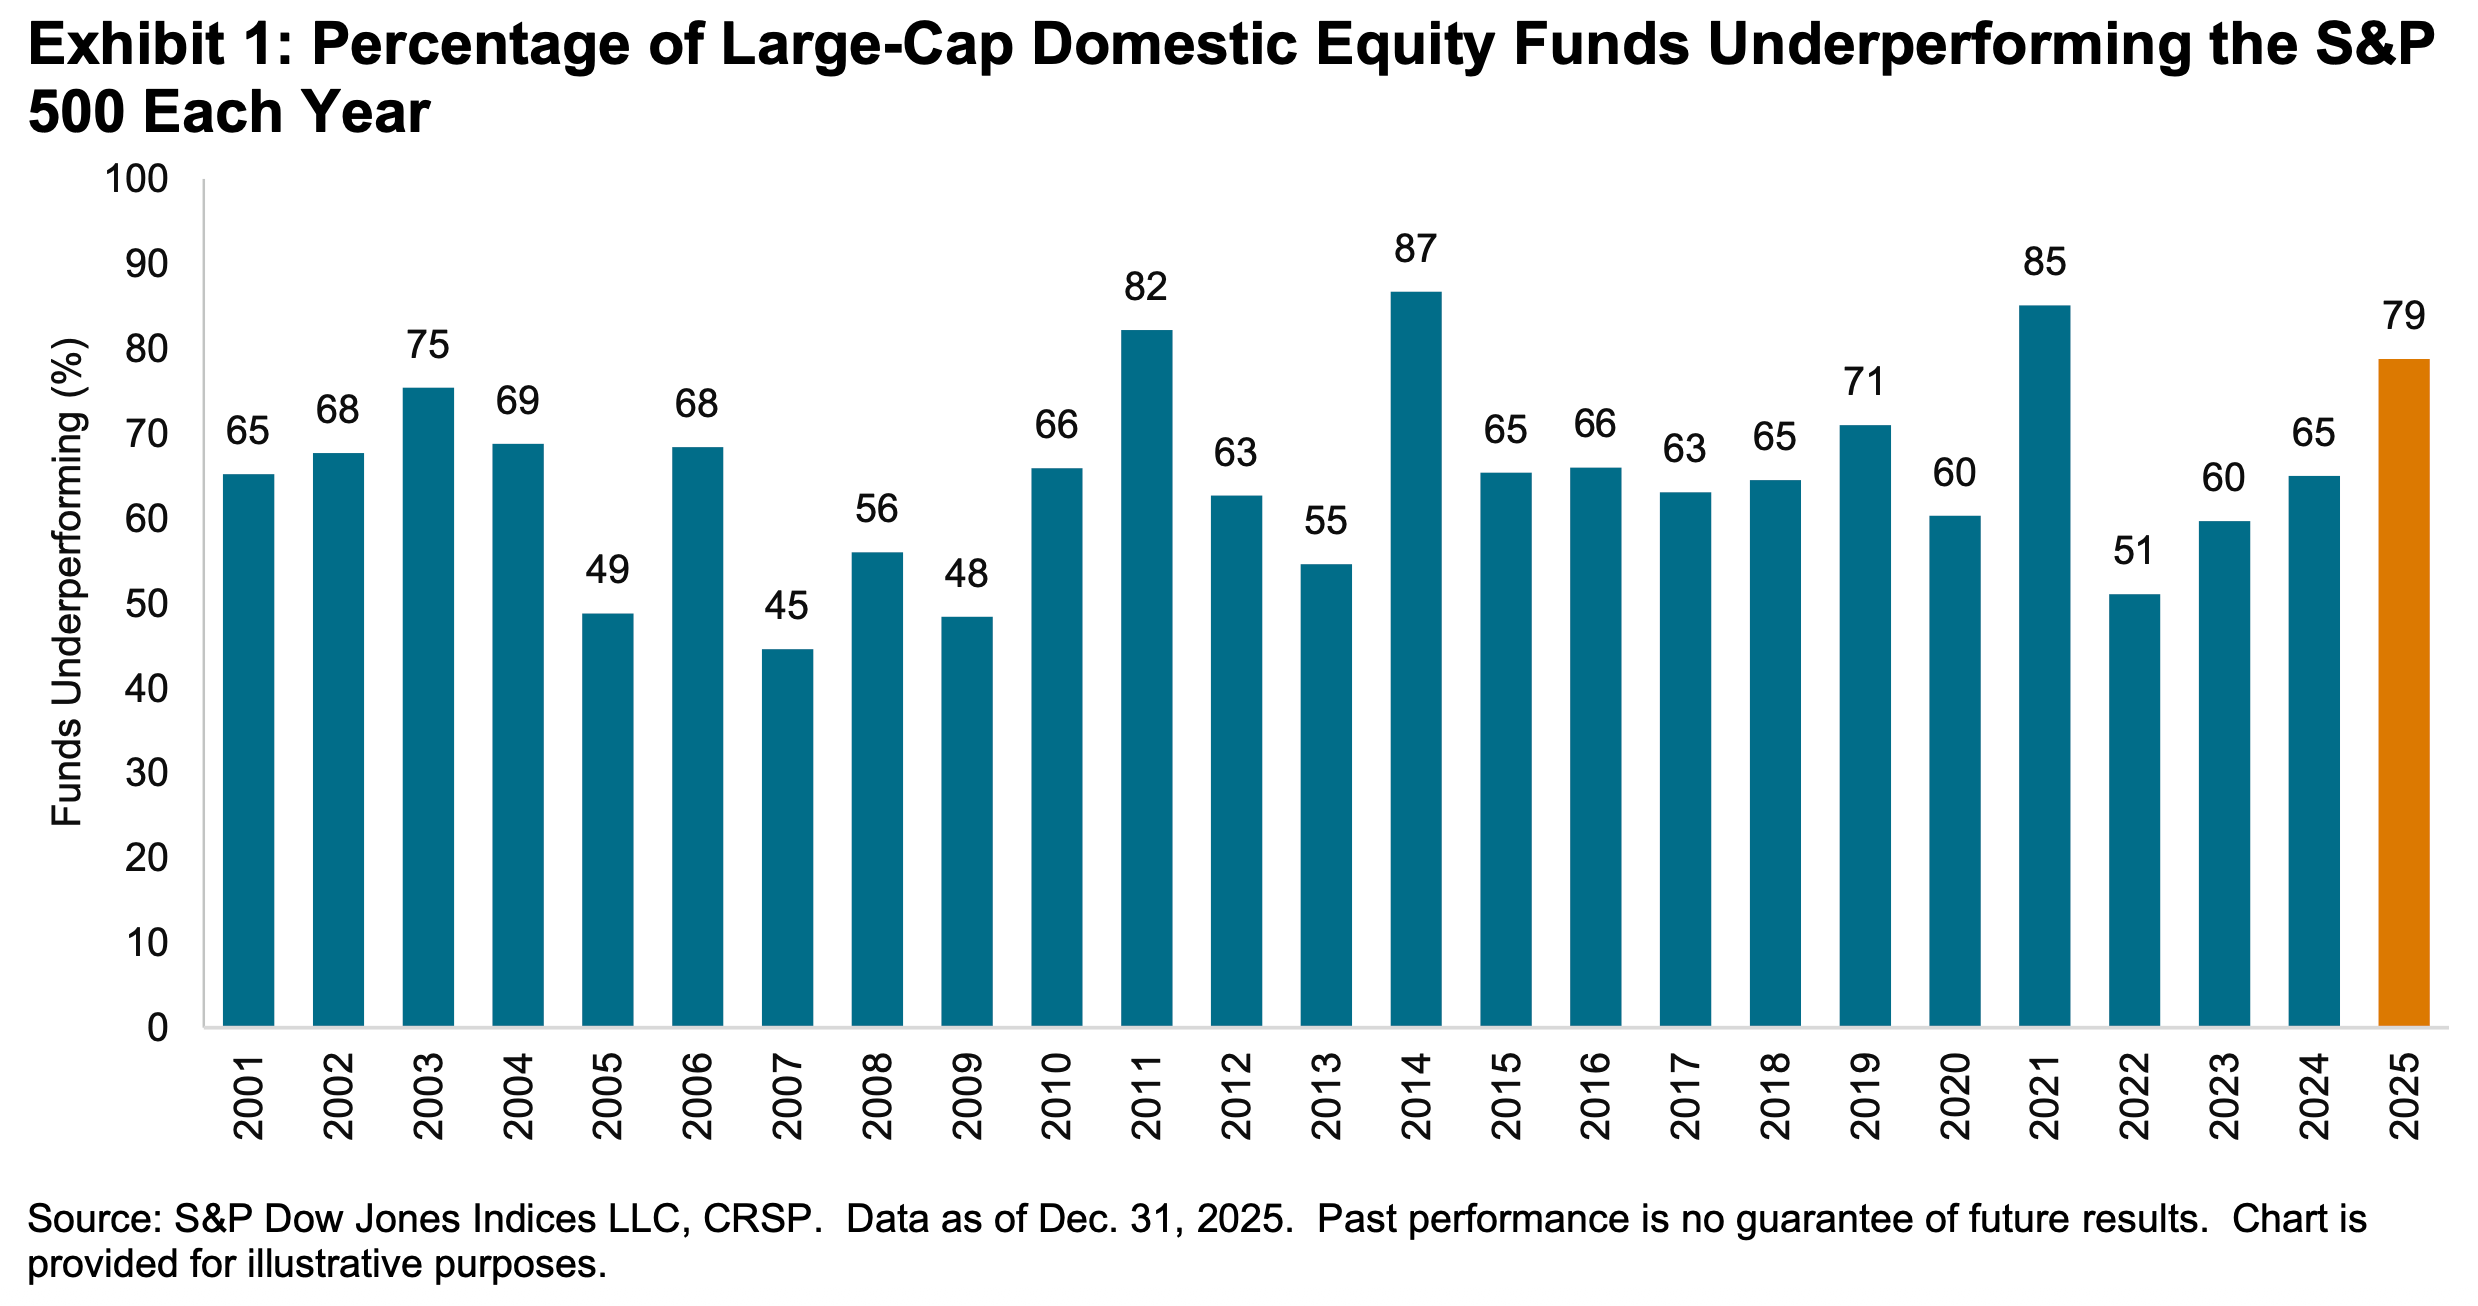
According to S&P Dow Jones Indices (SPDJI), 79% of U.S. large-cap equity fund managers underperformed the S&P 500 in 2025. As you extend the time horizon, the numbers get even worse. Over three years, 67% underperformed. Over 5 years, 89% underperformed. And over 20 years, 93% underperformed. This 2025 performance marked the 16th consecutive year the majority of fund managers in this category have lagged the index.
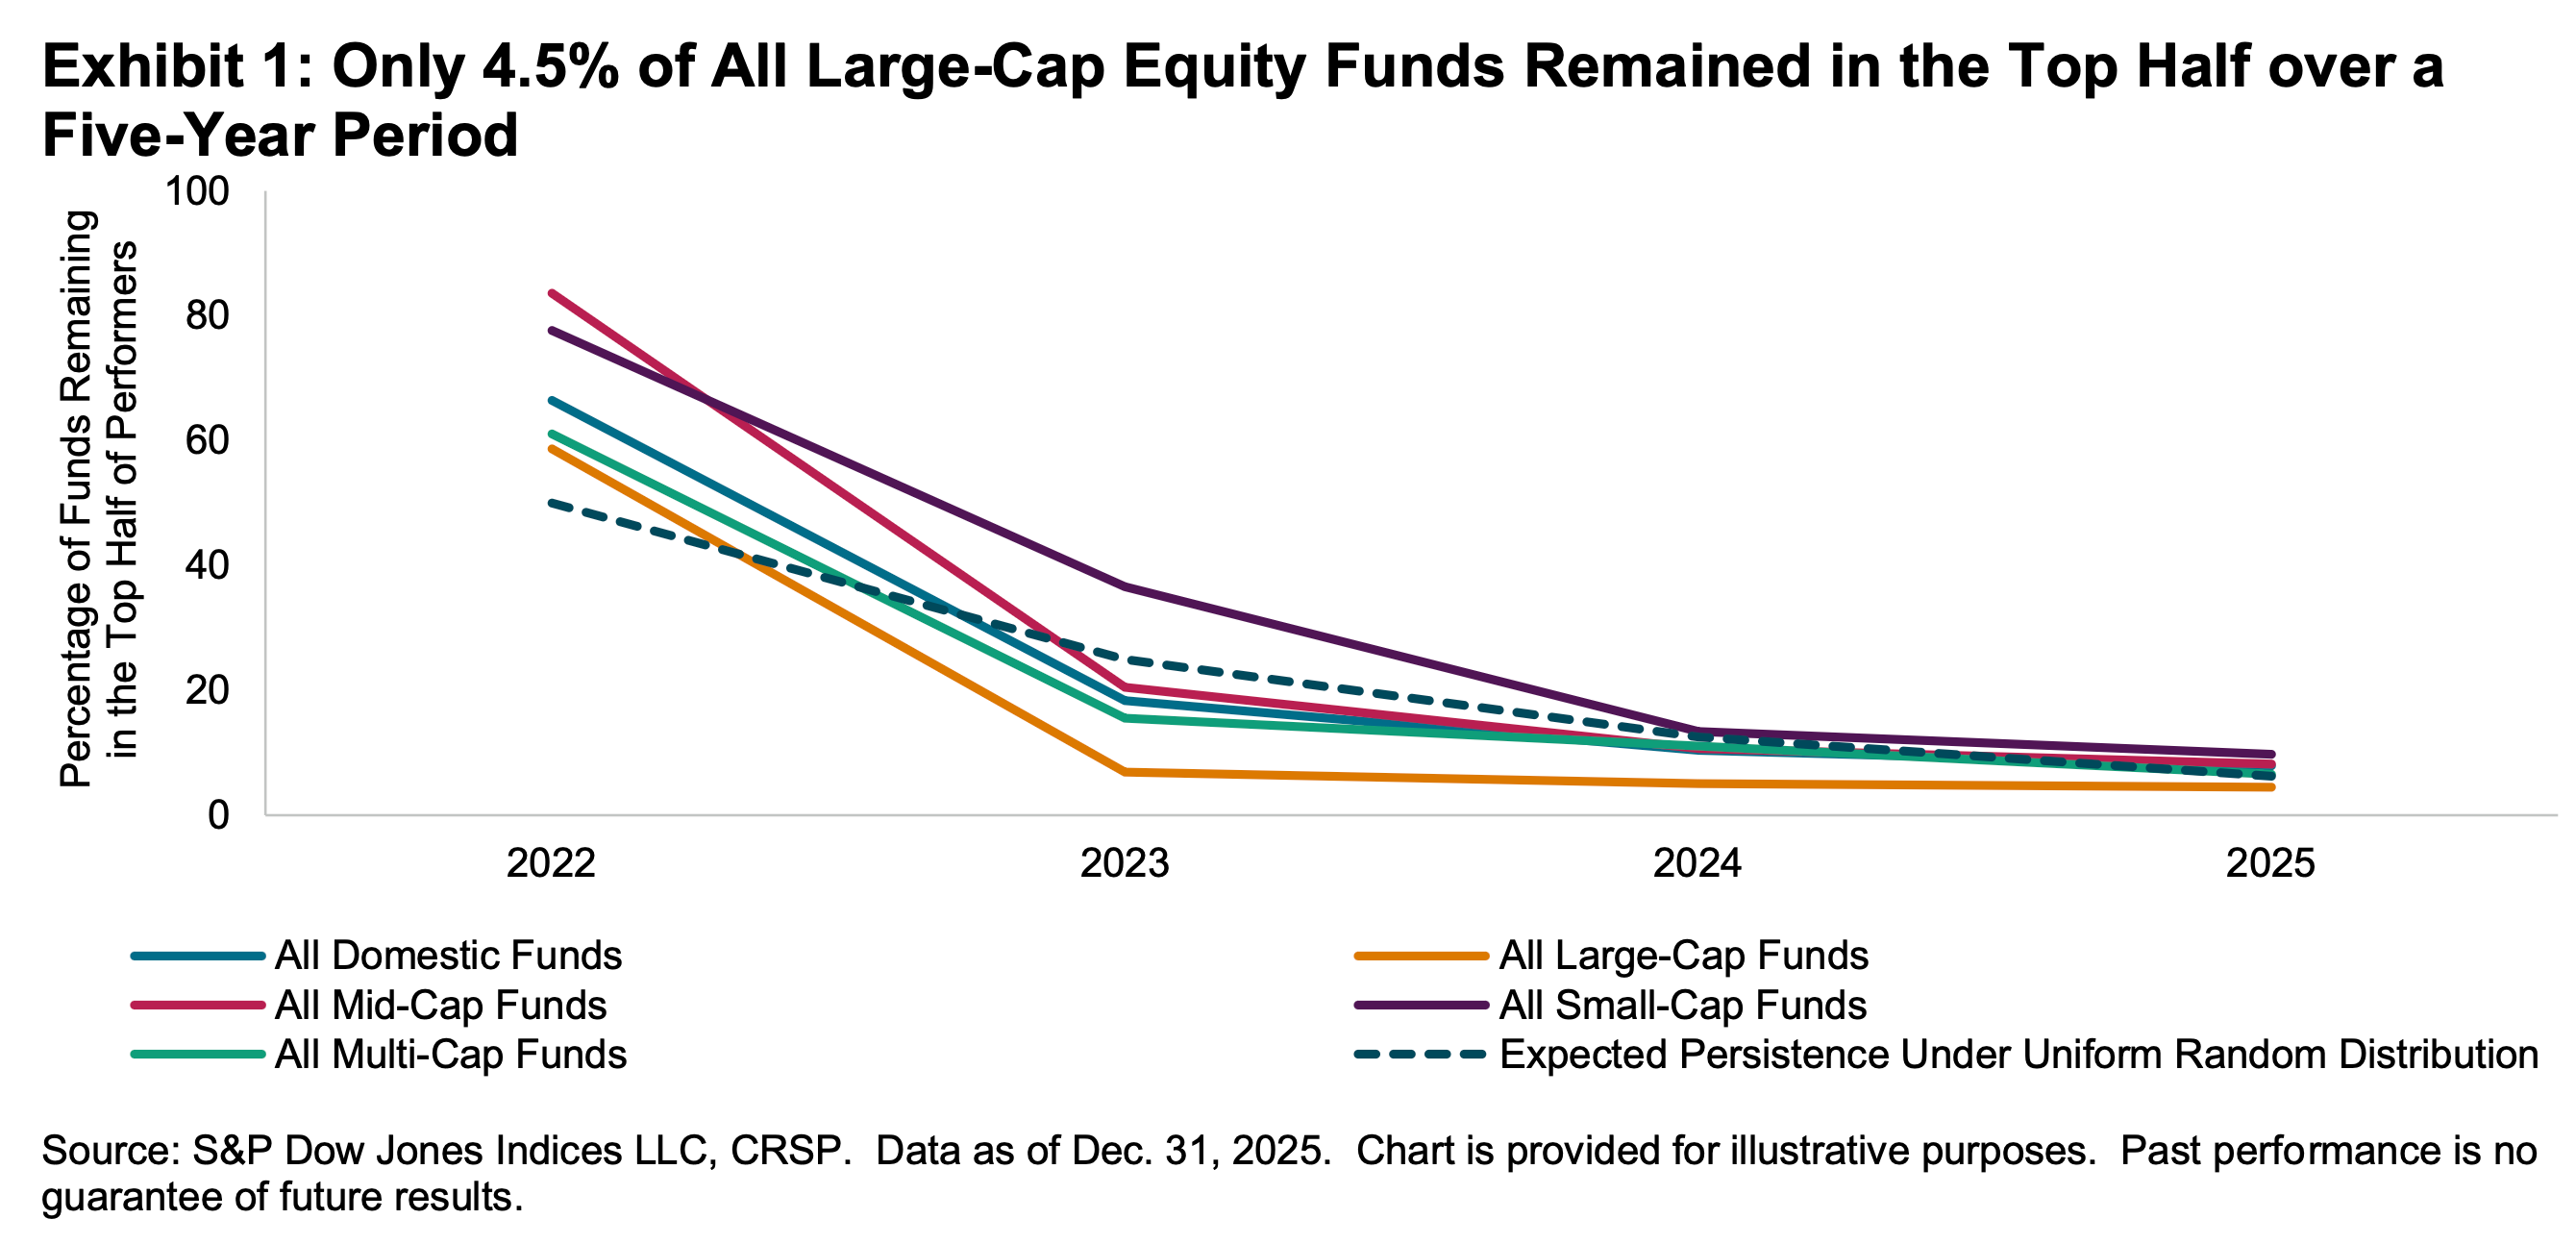
Even if you are a fund manager who generated industry-leading returns in one year, history says it’s an almost insurmountable task to stay on top consistently in subsequent years. According to S&P Dow Jones Indices, of the 334 large-cap equity funds in the top half of performance in 2021, 58.7% remained at the top half in 2022. However, just 6.9% remained on top through 2023. Only 4.5% stayed on top in the five consecutive years through 2025.
It’s much more dismal when you raise the bar. Of the 164 large-cap equity funds in the top quartile in 2021, just 20.1% remained in that category in 2022. That percentage fell to literally 0.0% in 2023.
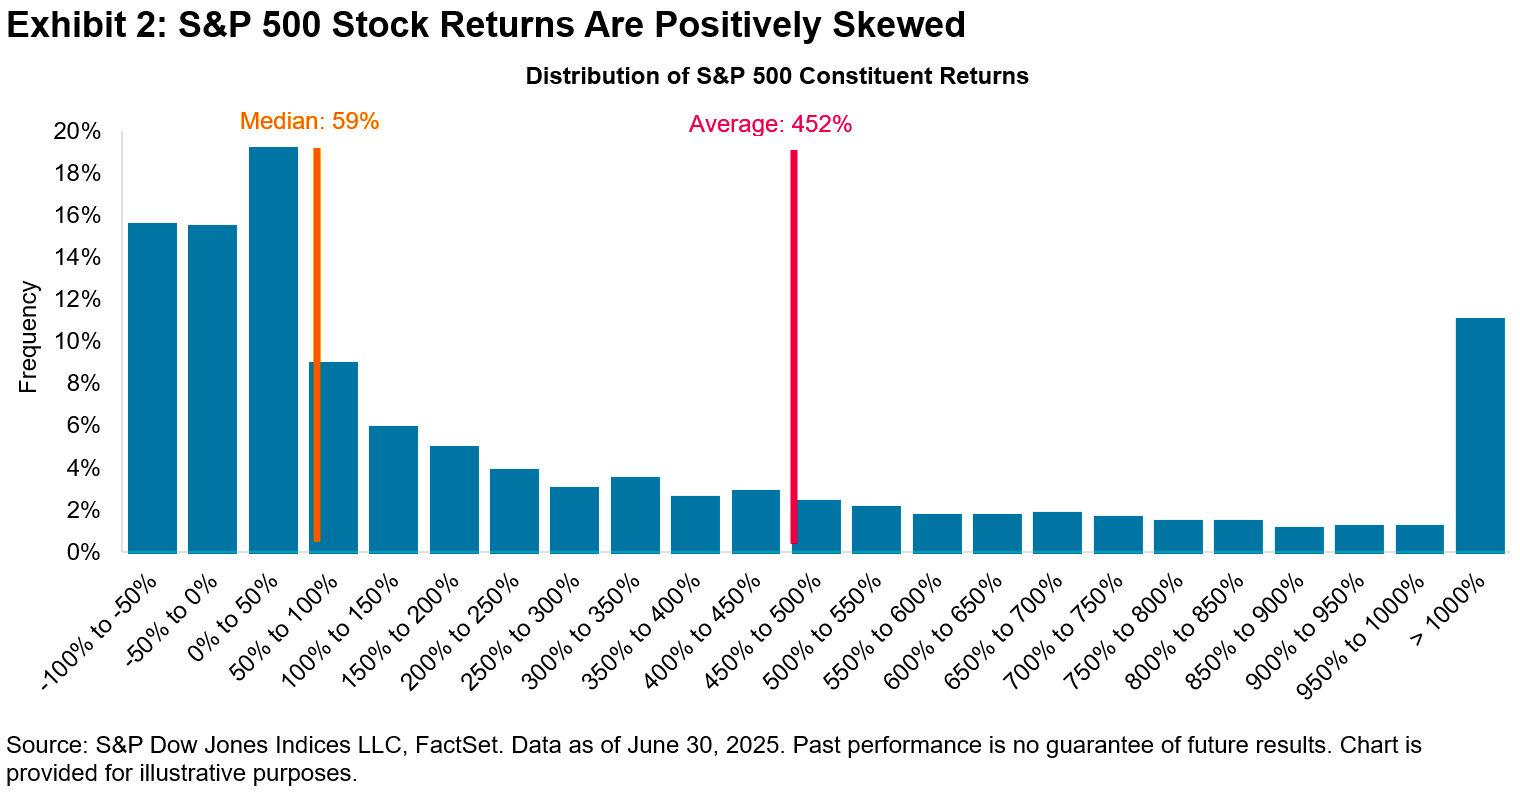
Picking stocks in an attempt to beat market averages is an incredibly challenging and sometimes money-losing effort. Most professional stock pickers can’t do this consistently. One reason is that most stocks don’t deliver above-average returns. According to S&P Dow Jones Indices, only 19% of S&P 500 stocks outperformed the average stock return from 2001 to 2025. Over this period, the average S&P 500 stock returned 452%, while the median stock returned just 59%.