ICE Futures U.S. Sugar No.11 Contract
| Settlement (cUS$/lb) | Open | High | Low | Last | Volume | O/I | Life High | Life Low | |||
|---|---|---|---|---|---|---|---|---|---|---|---|
*Volume includes exchange for physicals.
ICE U.S. Sugar No.11 – Spreads
| Date | Spread | Date | Spread |
|---|---|---|---|
| Mar27 / May27 | 0.52 | Oct27 / Mar28 | -0.22 |
| Mar27 / Jul27 | 0.94 | Oct27 / May28 | 0.93 |
| Mar27 / Oct27 | 1.06 | Mar28 / May28 | 1.15 |
| Mar27 / Mar28 | 0.84 | Mar28 / Jul28 | 1.79 |
| May27 / Jul27 | 0.42 | May28 / Jul28 | 0.64 |
| May27 / Oct27 | 0.54 | May28 / Oct28 | 0.78 |
| Jul27 / Oct27 | 0.12 | Jul28 / Oct28 | 0.14 |
| Jul27 / Mar28 | -0.10 | Jul28 / Mar29 | -0.15 |
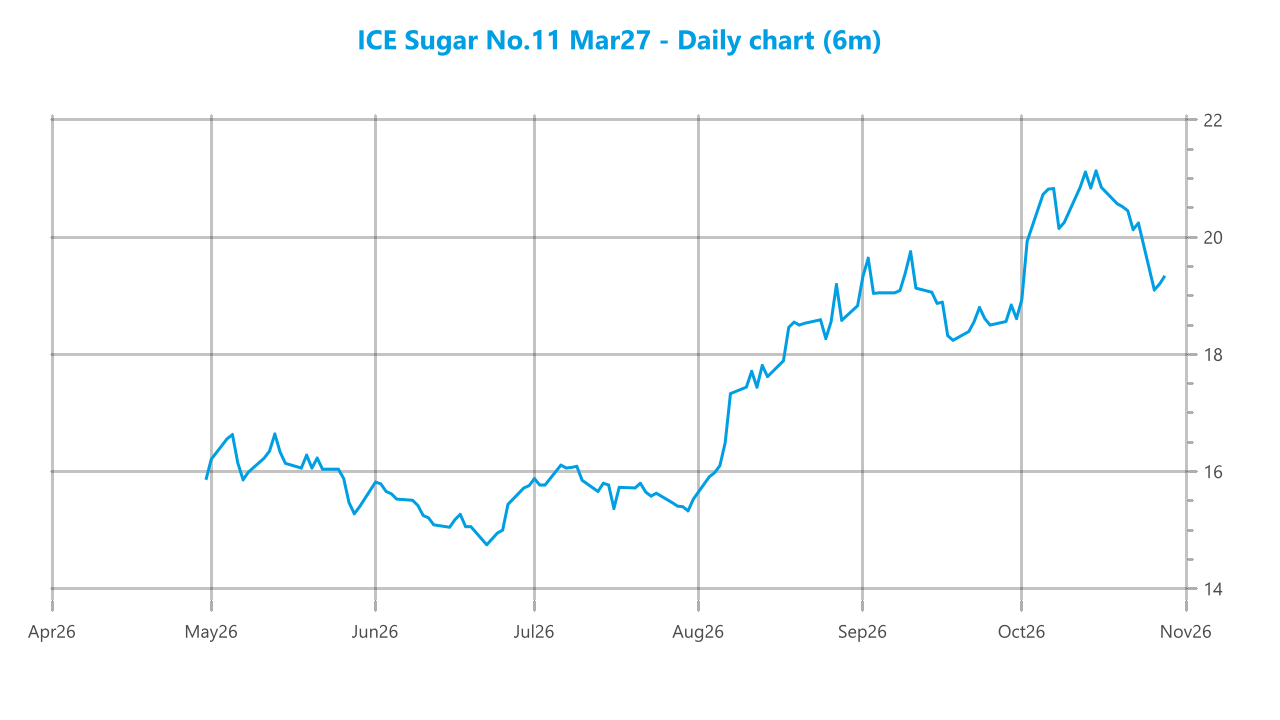
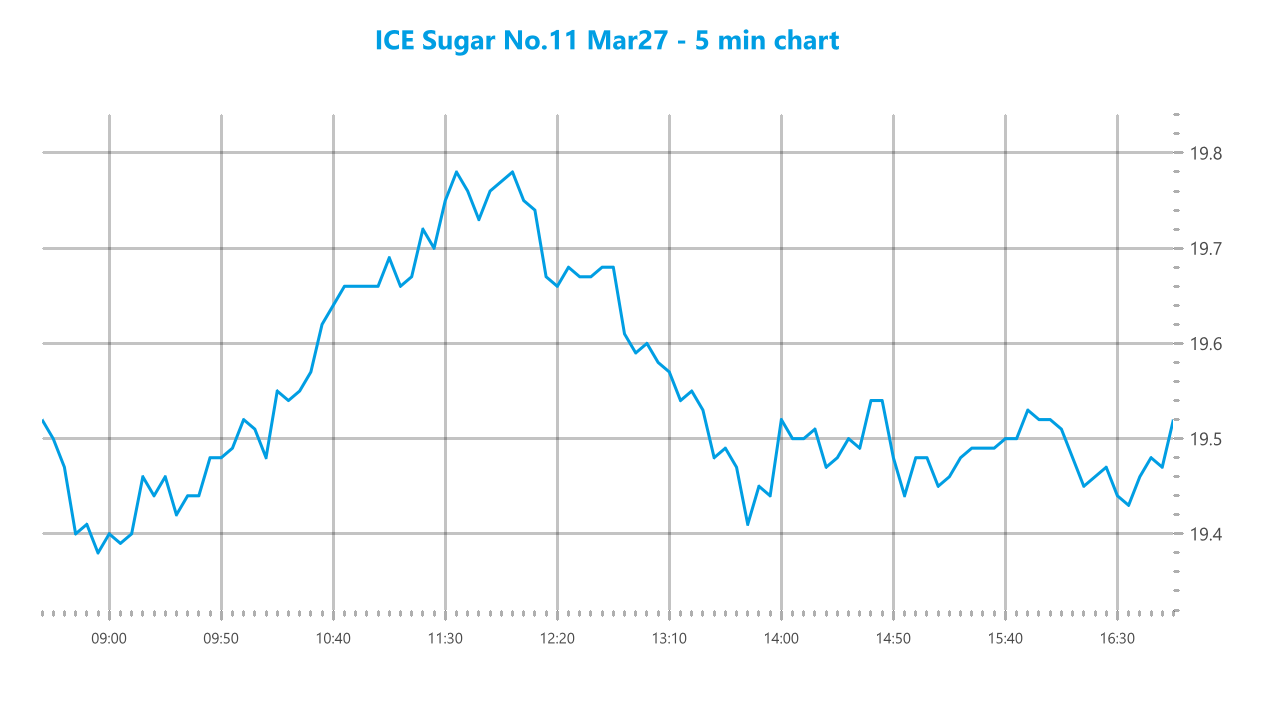
No.11 opened at 19.39 and initially moved lower, with early selling taking prices to the session low of 19.34. Support emerged quickly at those levels, triggering a steady recovery through the morning as the market moved back above the opening level. The advance gathered momentum into the middle of the session, with only brief pauses along the way, before prices reached the day’s high of 19.80 around midday. The rally then lost traction and reversed sharply, with sustained selling pressure pulling the market progressively lower through the early afternoon and erasing most of the earlier gains. No.11 eventually stabilized near the lower end of the range, after which price action became more balanced and largely sideways. Several recovery attempts followed late in the session but struggled to develop into a sustained rally. A final modest rebound lifted No.11 to 19.47, leaving the market above the open but well below the intraday peak.
ICE Europe White Sugar Futures Contract
| Settlement (US$/mt) | Open | High | Low | Last | Volume | O/I | Life High | Life Low | |||
|---|---|---|---|---|---|---|---|---|---|---|---|
*Volume includes exchange for physicals.
ICE Europe White Sugar – Spreads
| Date | Spread | Date | Spread |
|---|---|---|---|
| Dec26 / Mar27 | -15.10 | Mar27 / May27 | -4.90 |
| Dec26 / May27 | -20.00 | May27 / Aug27 | 5.00 |
| Dec26 / Aug27 | -15.00 | Aug27 / Oct27 | 7.90 |
| Dec26 / Oct27 | -7.10 | Oct27 / Dec27 | 5.90 |
White Sugar Premium
| Date | Premium | Date | Premium |
|---|---|---|---|
| Mar27 / Mar27 | 113.46 | Jul28 / Aug28 | 131.64 |
| May27 / May27 | 129.82 | Oct28 / Oct28 | 125.03 |
| Jul27 / Aug27 | 134.08 | Mar29 / Mar29 | 119.64 |
| Oct27 / Oct27 | 128.83 | May29 / May29 | 129.22 |
| Mar28 / Mar28 | 113.88 | Jul29 / Aug29 | 133.85 |
| May28 / May28 | 129.73 |
*Values calculated basis 5:08 PM.
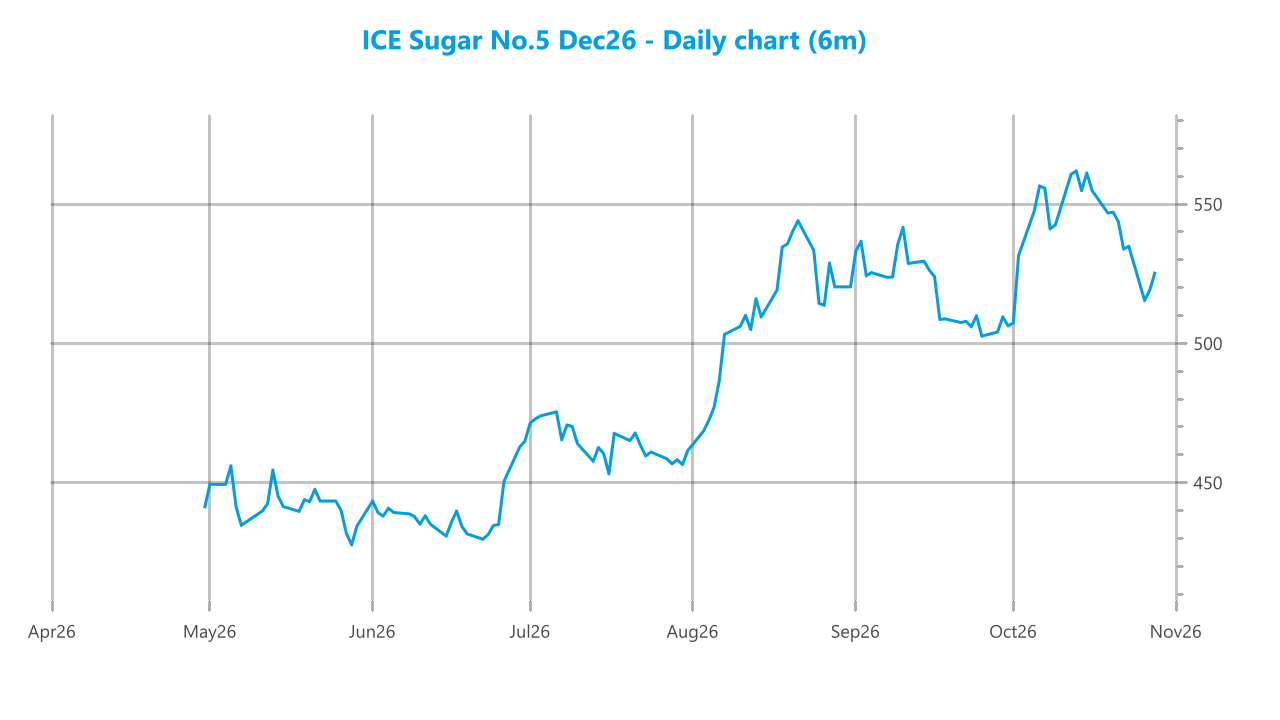
No.5 opened at 528.30 and initially moved lower, with early selling taking prices toward the session low of 524.40 before support emerged. The market then reversed course through the morning, with buying gathering momentum and pushing prices decisively above the opening level. The advance accelerated into midday, carrying No.5 toward the upper end of the range and eventually to the session high of 538.30. Prices held near the highs for a period, but the rally subsequently lost momentum and gave way to a steady reversal during the early afternoon, potentially reflecting some producer pricing at the higher levels. Selling pressure gradually pulled the market back toward the opening area, although support developed before the earlier low was challenged again. Late-afternoon trading became more consolidated, with prices fluctuating within a relatively narrow range after the larger earlier swings. No.5 ultimately closed at 527.60, slightly below the opening level and well off the session high.