Key highlights
- Mobile phones generated Rs 807.61 crore, or 96.59%, of Umiya Mobile’s FY26 revenue.
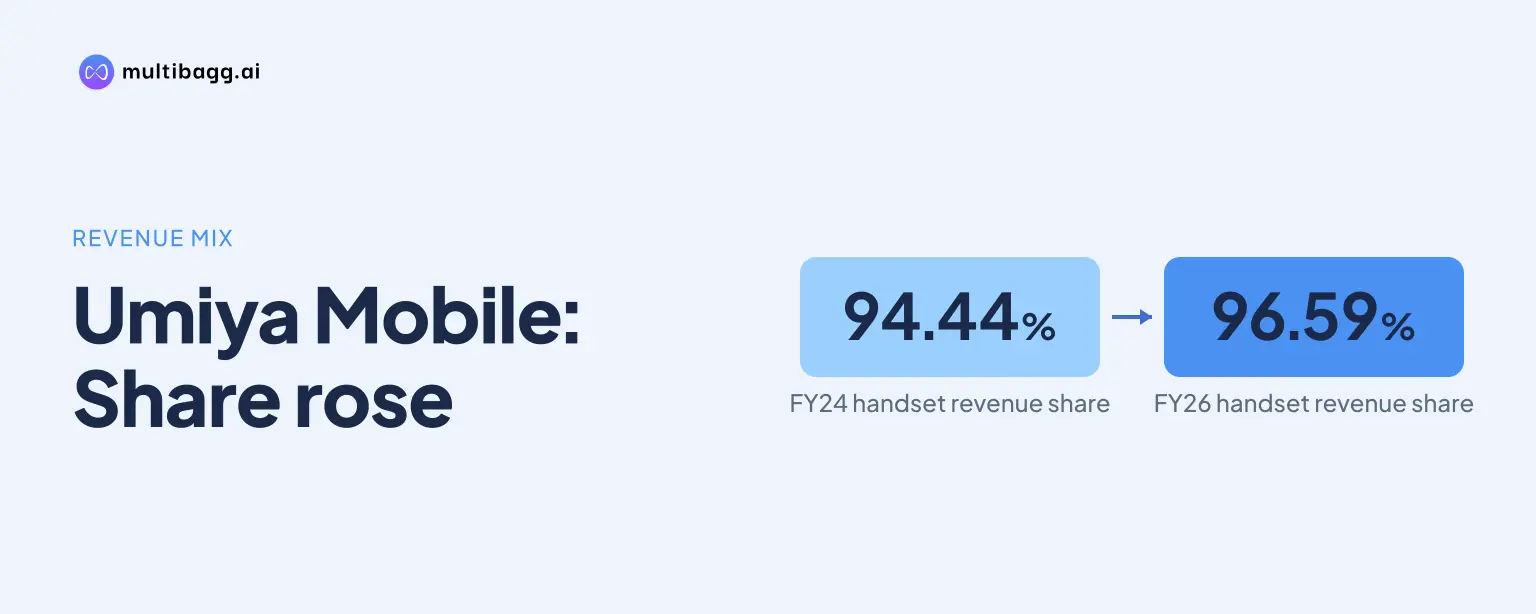
- Umiya Mobile’s mobile revenue share rose from 94.44% in FY24 to 96.59% in FY26.
- FY26 non-mobile revenue was Rs 28.48 crore, down from Rs 28.92 crore in FY25.
- The Retail Outlet Model contributed 47.57% of FY26 revenue, up from 38.11% in FY24.
powered by IRIS
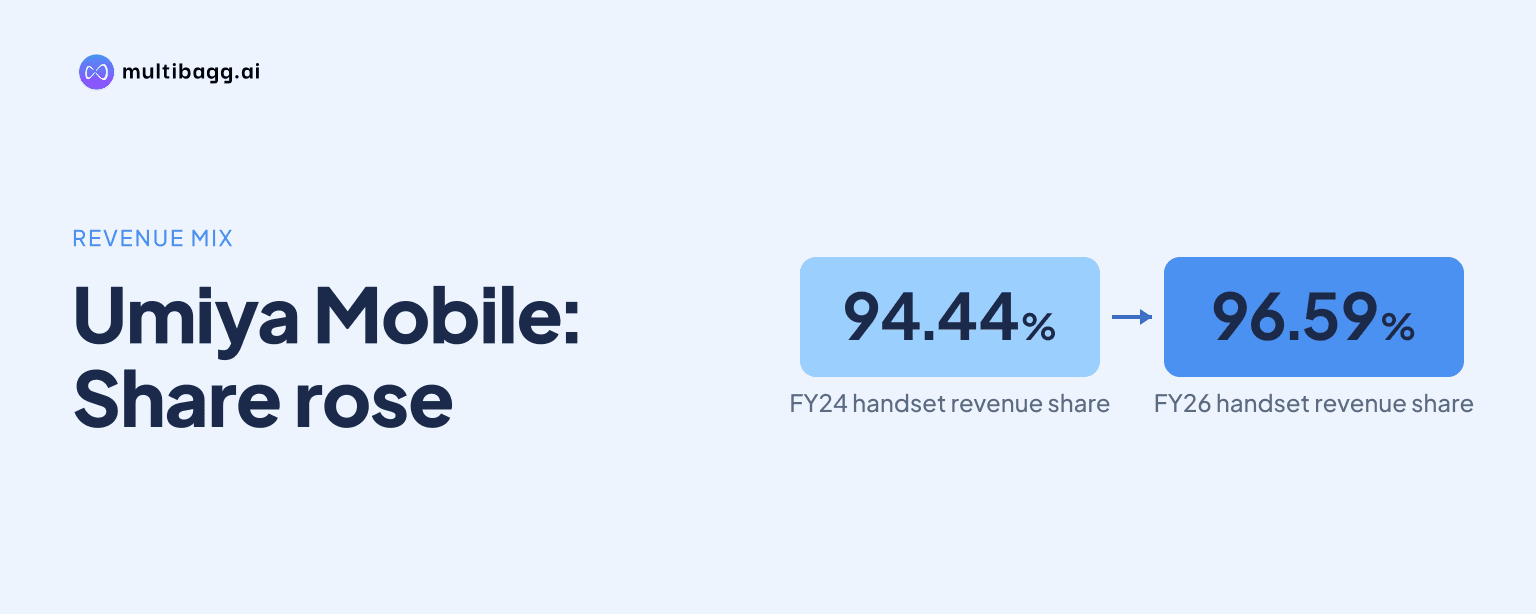
Umiya Mobile Limited generated 96.59% of FY26 revenue from mobile phones, up from 94.44% in FY24, as mobile sales reached Rs 807.61 crore out of total revenue of Rs 836.10 crore. The remaining product categories accounted for 3.41% of FY26 revenue, compared with 5.57% two years earlier.
Know Umiya Mobile inside out
Results, valuation, peers and who’s buying, in one view.
Why did Umiya Mobile’s handset revenue concentration increase in FY26?
Umiya Mobile’s handset concentration increased because mobile revenue rose faster than the company’s other reported product categories. Mobile sales grew from Rs 400.48 crore in FY24 to Rs 531.16 crore in FY25 and Rs 807.61 crore in FY26. Consequently, the mobile share increased from 94.44% in FY24 to 94.84% in FY25 and then to 96.59% in FY26.
Total revenue rose by Rs 412.02 crore over the two years to FY26, reaching Rs 836.10 crore from Rs 424.08 crore. Mobile revenue increased by Rs 407.13 crore over the same period, indicating that handsets supplied almost all of the reported revenue increase. The mobile share therefore rose by 2.15 percentage points between FY24 and FY26.
The reported Others segment, comprising laptop/tablet, home appliances, accessories and services, generated Rs 28.48 crore in FY26, compared with Rs 23.60 crore in FY24. Although its revenue increased in absolute terms over two years, it did not keep pace with the Rs 407.13 crore rise in mobile sales, reducing its revenue share to 3.41% from 5.57%.
How did Umiya Mobile’s mobile revenue compare with total revenue growth?
Umiya Mobile’s mobile revenue increased by 52.05% in FY26, against 49.28% growth in total revenue. Mobile sales rose by Rs 276.45 crore from Rs 531.16 crore in FY25, while total revenue rose by Rs 276.02 crore from Rs 560.08 crore. The difference reflects a decline in the combined revenue of reported non-mobile categories during FY26.
In FY25, mobile sales increased by Rs 130.67 crore from FY24, while total revenue increased by Rs 136.00 crore. Mobile’s share nonetheless moved up by 0.40 percentage points to 94.84% in FY25 because its 32.63% revenue growth was slightly above the 32.07% growth in total revenue.
The presentation does not disclose handset unit volumes, average selling prices, brands or product-level margins for FY24 through FY26. As a result, the reported increase from Rs 400.48 crore of mobile revenue in FY24 to Rs 807.61 crore in FY26 cannot be separated between unit growth, pricing changes or changes in the handset mix.
Got a follow-up? Ask IRIS
Which non-mobile product categories changed in FY26?
Umiya Mobile reported higher laptop/tablet and home-appliance revenue in FY26, while accessories declined and the services row was shown as a dash. Laptop/tablet revenue reached Rs 8.70 crore, up from Rs 5.86 crore in FY25 and Rs 3.98 crore in FY24. Home-appliance revenue increased to Rs 9.13 crore from Rs 6.46 crore and Rs 4.94 crore, respectively.
Accessories contributed Rs 10.66 crore in FY26, down from Rs 10.81 crore in FY25 and Rs 10.84 crore in FY24. Services were reported at Rs 5.78 crore in FY25 and Rs 3.84 crore in FY24, but the FY26 table shows a dash. The presentation does not state whether that dash denotes no services revenue, a reclassification or another reporting change.
The FY26 laptop/tablet, home-appliance and accessories lines total Rs 28.48 crore, matching the reported 3.41% Others share. This was Rs 0.44 crore below the Rs 28.92 crore reported for non-mobile categories in FY25. Growth of Rs 2.66 crore in appliances and Rs 2.83 crore in laptops/tablets did not offset the unreported FY26 services line and the Rs 0.15 crore decline in accessories.
How was Umiya Mobile’s FY26 revenue split by store model and customer type?
Umiya Mobile generated more FY26 revenue through owned stores, although the Retail Outlet Model increased its contribution. Owned stores produced Rs 438.37 crore, or 52.43% of FY26 revenue, and the Retail Outlet Model generated Rs 397.73 crore, or 47.57%. In FY24, the split was 61.89% from owned stores and 38.11% from the Retail Outlet Model.
The Retail Outlet Model added Rs 236.11 crore of revenue between FY24 and FY26, increasing from Rs 161.62 crore. Owned-store revenue increased by Rs 175.91 crore from Rs 262.46 crore over the same period. Thus, channel revenue became less concentrated in owned stores while product revenue became more concentrated in mobile phones.
Business-to-consumer, or B2C, revenue was Rs 612.30 crore in FY26, representing 73.23% of total revenue, while business-to-business, or B2B, revenue was Rs 223.79 crore, or 26.77%. B2C accounted for 77.65% in FY24 and 72.50% in FY25. B2B revenue rose from Rs 94.80 crore in FY24, but its FY26 share remained below the 27.50% reported for FY25.
Conclusion
Umiya Mobile’s FY26 revenue growth was predominantly handset-led, with mobile sales of Rs 807.61 crore accounting for 96.59% of total revenue of Rs 836.10 crore. While laptop/tablet and home-appliance revenue rose, the combined non-mobile contribution fell to 3.41% of revenue as services were not reported in the FY26 product table and accessories declined slightly.
The next product-mix disclosure will show whether the 96.59% mobile share changes after FY26. The presentation provides H1 FY27 balance-sheet figures, including inventory of Rs 154.34 crore and short-term loans and advances of Rs 48.09 crore, but it does not disclose H1 FY27 product revenue, a diversification target or a timetable for non-mobile categories.
Frequently Asked Questions
Umiya Mobile reported that mobile phones contributed 96.59% of FY26 revenue. Mobile revenue was Rs 807.61 crore, while total FY26 revenue was Rs 836.10 crore.
Yes, based on its reported product mix. Mobile represented 94.44% of revenue in FY24, 94.84% in FY25 and 96.59% in FY26, an increase of 2.15 percentage points from FY24.
Accessories were the largest reported non-mobile category at Rs 10.66 crore in FY26. Home appliances generated Rs 9.13 crore and laptop/tablet sales generated Rs 8.70 crore.
Others revenue declined to Rs 28.48 crore in FY26 from Rs 28.92 crore in FY25. Appliances and laptops/tablets increased, but accessories fell slightly and the FY26 services row was shown as a dash after Rs 5.78 crore in FY25.
Owned stores accounted for 52.43% of FY26 revenue, down from 61.89% in FY24. The Retail Outlet Model increased to 47.57% from 38.11% and generated Rs 397.73 crore in FY26.