September was, as expected, a negative month for stock market returns. However, according to historical seasonal patterns, we are now entering the friendliest period for equity market investors.
With the T-Bond yield at 19-year highs, the intensification of conflicts in Ukraine and Iran, and persistent doubts regarding the sustainability of investment in the AI theme, the market stalled in September and investor sentiment also suffered from a lack of visibility. And, despite all of this, this week the S&P 500 reached record highs again.
Multiple compression, in an environment of very strong growth in earnings per share, has acted as a shield against geopolitical uncertainty and the flattening of the yield curve.
The fact is that signs point to an interesting end of the year in stock markets.
Inflation, Fed, and Warsh’s Working Groups The latest employment data, with worse-than-expected payroll growth in the U.S., consolidates the idea that the Fed’s focus of attention remains on inflation.
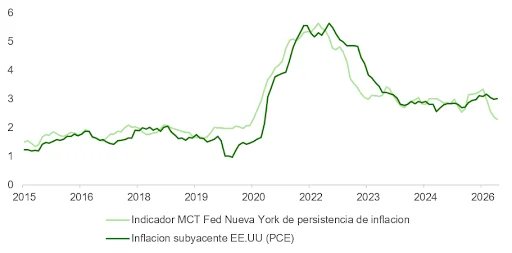
Likewise, last week’s latest PCE release—along with the drop in the price of a barrel of crude oil—provides positive short-term signals, confirming inflation expectations (measured with 5-year 5-year forward breakevens) that have been retreating in recent months and are approaching the 2% mark. In addition, there are indications pointing to a decline in structural price pressures. The U.S. PCE inflation trend indicator calculated by the New York Fed, which seeks to capture the persistence of inflationary pressures, has been falling since April and, although it is a series subject to revisions, Truflation’s “real-time” inflation gauge offers a similar perspective.
It is curious that surprises in U.S. inflation and hiring data have abated considerably since June, while the Fed toughens its hawkish rhetoric. However, the divergence does not necessarily imply inconsistency: the Fed reacts to the level of inflation—with core PCE still at 3.4%, after five years above the target—rather than to the pace of surprises, and with a real rate close to ~0.5% it considers its policy barely restrictive. Added to this is a credibility component: a new chairman under public pressure to cut rates has incentives to demonstrate independence before opening the door to a pivot.
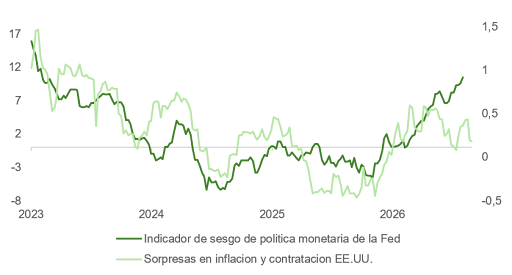
The results of the Fed’s working groups (communication, balance sheet, data sources, productivity and employment, and inflation framework) could be an unexpected positive surprise ahead of the end of the year. Revising the inflation framework cannot be done with credibility if the Fed appears dovish while doing so. The data sources group could be key: Warsh prefers market-based and real-time inflation indicators (breakevens, Truflation-style measurements), and today those indicators point to disinflation. It is a hypothesis, but I would watch that group as a potential catalyst for a turn toward a less hawkish policy in 2027.
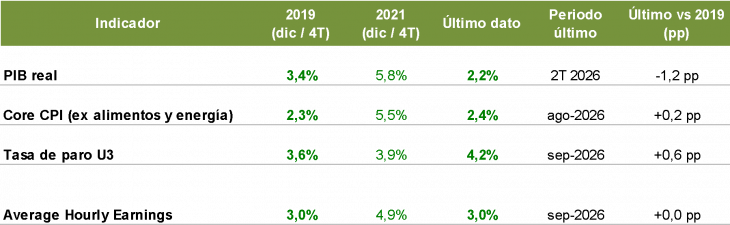
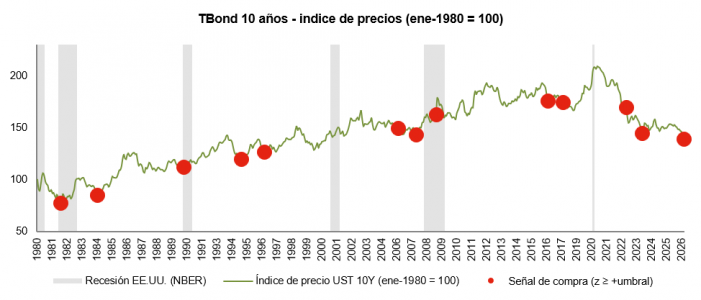
Valuation, Elections, and Earnings: The Bullish Case Real growth in the U.S. economy, wages, and inflation are already very close to the stage prior to the COVID-driven IPC surge. Although this does not mean we will return to a rate environment similar to that period, the curve does appear to maintain excessive skepticism regarding rate hike expectations. The spike in the bond yield relative to estimated U.S. GDP growth for the next 12 months sits at more than 1.5 standard deviations, a threshold that, since 1980, has resulted in past bond price rallies.
If this happens again, in an environment of solid corporate earnings growth, the S&P 500’s multiple would have room to recover.
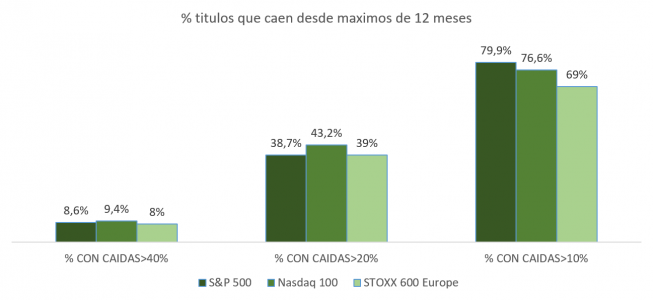
38.7% of the stocks that make up the S&P 500 have accumulated drops of 39% from their 12-month highs. With the market anticipating greater monetary policy tightening than what is conveyed by the Fed’s “dot plot,” the context seems ideal for a positive repricing of risk assets before the end of the year.
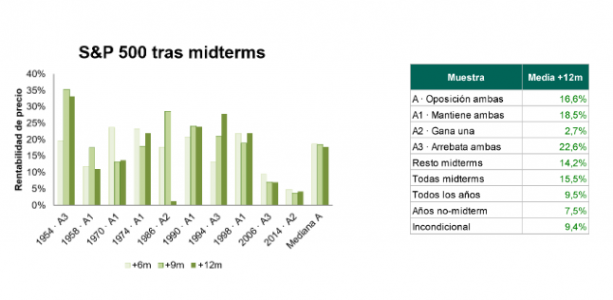
We are just a few weeks away from the midterm elections. Betting houses and polls show a certain balance in the Senate (with positive momentum for the Democrats), and certainty regarding the Republicans losing the House of Representatives. Since 1950, three episodes have been recorded (out of the 19 midterms that have taken place since 1950) in which the opposition (in this case, the Democrats) snatched control of both houses from the incumbent party. 12 months after the elections, returns are positive in all cases and exceed, on average, both the S&P 500 return across all periods and the unconditional return and that recorded across the 19 midterms analyzed since 1950. The historical precedent is favorable, but, considering that only 3 of the 19 observed processes showed the likely outcome on November 4, the solid argument supporting good post-election performance is the midterm cycle, not the composition of Congress.
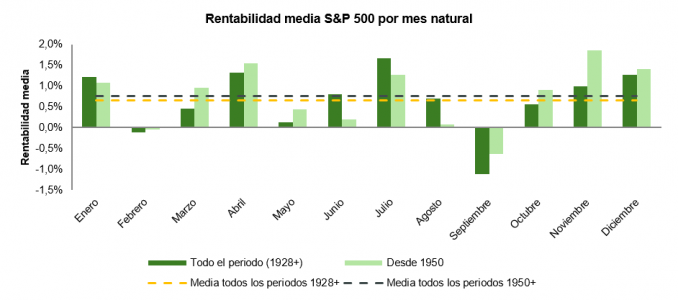
Along the same lines and, as explained above, the period between October and December is historically the most profitable for investors. The market has cleared technical overbought conditions, and investor sentiment has shifted to become less optimistic and more skeptical.
Finally, next week the earnings reporting season begins in the U.S., and the third quarter is shaping up to be positive for investors. Consensus anticipates that all 11 industrial sectors comprising the S&P 500 will report growth in revenues and earnings, an almost unprecedented situation over the last 25 years. The bar, however, is set higher than in previous quarters.