TL;DR: Gold’s selloff has accelerated into a rout, breaking major long-term support even as Treasury yields fall, which points to broad cross-asset risk reduction rather than interest rates as the driver. With that long-term retracement broken, 3,321–3,323 is the next major area to watch, and a move toward 3,000 cannot be ruled out.
Why Is Gold Falling Even as Treasury Yields Drop?
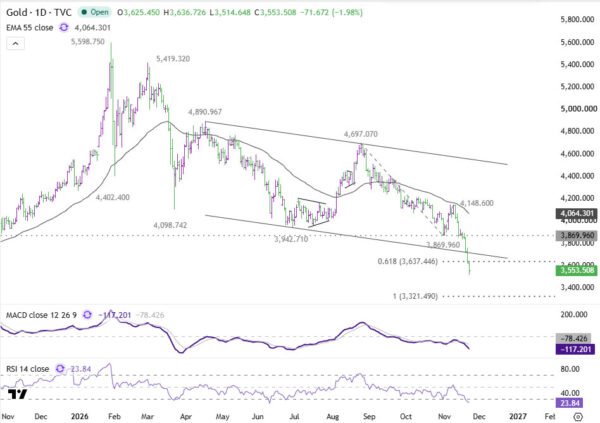
Gold’s selloff has accelerated sharply this week, with the metal breaking major long-term technical support even as US Treasury yields retreat. Gold traded around 3,558 in Friday’s Asian session, down more than 8% for the week and approximately 36% below its January record high of 5,598.75. The decisive break below the 38.2% retracement of the entire 2015–2026 advance at 3,859.80 raises the prospect of a substantially deeper correction, with the next major technical objective around 3,321–3,323 and the psychological 3,000 level emerging as a possible further downside target.
The decline appears to have developed in two stages. Hawkish repricing of Fed interest rate expectations initially pressured gold through higher Treasury yields and Dollar strength. More recently, however, selling has continued despite a substantial retreat in yields and little net change in Dollar. The shift coincides with heavy losses across global equities, precious metals and cryptocurrencies, suggesting that broader risk reduction may now be contributing to gold’s weakness.
Follow gold’s slide toward 3,321 and the cross-asset selling behind it on the ActionForex Telegram channel.
Fed Tightening Expectations Established the Downtrend
Gold’s earlier decline was driven partly by the sharp reassessment of US monetary policy expectations as inflation pressures strengthened and Fed officials signaled further tightening.
Higher interest rates increase the opportunity cost of holding non-yielding assets such as gold, while Dollar strength adds pressure by making the metal more expensive for buyers using other currencies.
These factors intensified last week as US Treasury yields surged and Dollar advanced. The pressure carried into Wednesday, when gold broke below 3,800 for the first time since September 2025, extending an already established downtrend.
The hawkish policy backdrop remains intact. Friday’s CME FedWatch reading assigned a 99.2% probability to a 25bps Fed rate hike in December, with only a small probability of no change. However, expectations for an unusually large 50bps increase have faded, while Treasury yields have retreated from Thursday’s levels.
Indeed, the latest price action marks an important change: gold is continuing to fall even as the interest rate pressure that helped establish its decline has eased. That suggests monetary policy expectations alone are insufficient to explain the most recent wave of selling.
Gold Weakens Alongside Equities as Investors Reduce Risk
Gold lost approximately 4.1% between Thursday’s pre-opening market snapshot and early Friday’s Asian session, even as US Treasury yields fell across maturities. The 10-year yield declined nearly 9bps to around 5.01%, while Dollar Index was little changed near 103.73.
- Gold: about −4.1% from Thursday’s pre-opening snapshot to early Friday
- US 10-year yield: nearly −9bps to around 5.01%
- Dollar Index: little changed near 103.73
Ordinarily, falling yields and a stable Dollar would ease two important headwinds for gold. Their failure to provide support suggests that other pressures have become more influential.
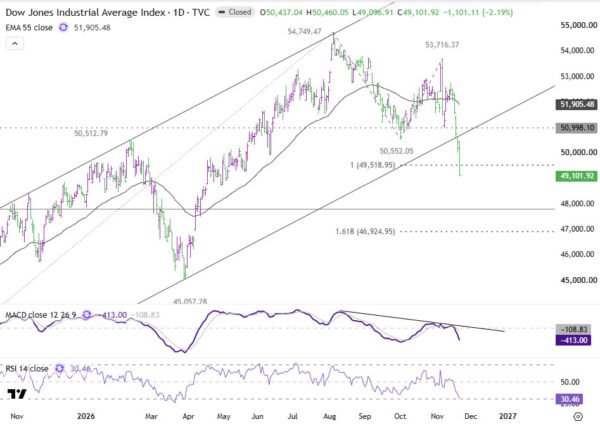
The latest decline coincided with a sharp deterioration in global risk sentiment. Wall Street suffered losses exceeding 2% across its major indexes on Thursday, while Japan’s Nikkei and South Korea’s KOSPI both closed Friday down more than 5%.
Selling also extended across precious metals, cryptocurrencies and industrial commodities. Silver fell approximately 6.4% over the same period, outpacing gold’s decline, while platinum, Bitcoin, Ether and copper also weakened.
- Wall Street: major indexes down more than 2% on Thursday
- Nikkei and KOSPI: both closed Friday down more than 5%
- Silver: about −6.4% over the same period; platinum, Bitcoin, Ether and copper also lower
This pattern is consistent with investors reducing exposure across asset classes, potentially including the sale of liquid gold positions to raise cash or rebalance portfolios. Such behavior can temporarily overwhelm gold’s traditional defensive characteristics, even when falling Treasury yields would otherwise provide support.
However, the available market data do not establish that forced liquidation or margin calls are driving the decline. There is no direct evidence from fund flows, positioning or margin activity to confirm the mechanism.
The stronger conclusion is that gold’s latest losses are occurring alongside broad cross-asset selling, rather than being driven primarily by another increase in Treasury yields.
Whether that pressure persists will depend partly on the direction of equity markets. Stabilization in global stocks could help reduce selling pressure on gold, while further equity losses may encourage additional risk reduction. A renewed rise in Treasury yields would also restore the monetary policy headwind that contributed to the earlier decline.
ActionForex’s Technical View: Gold Daily, Downside Acceleration Targets 3,321
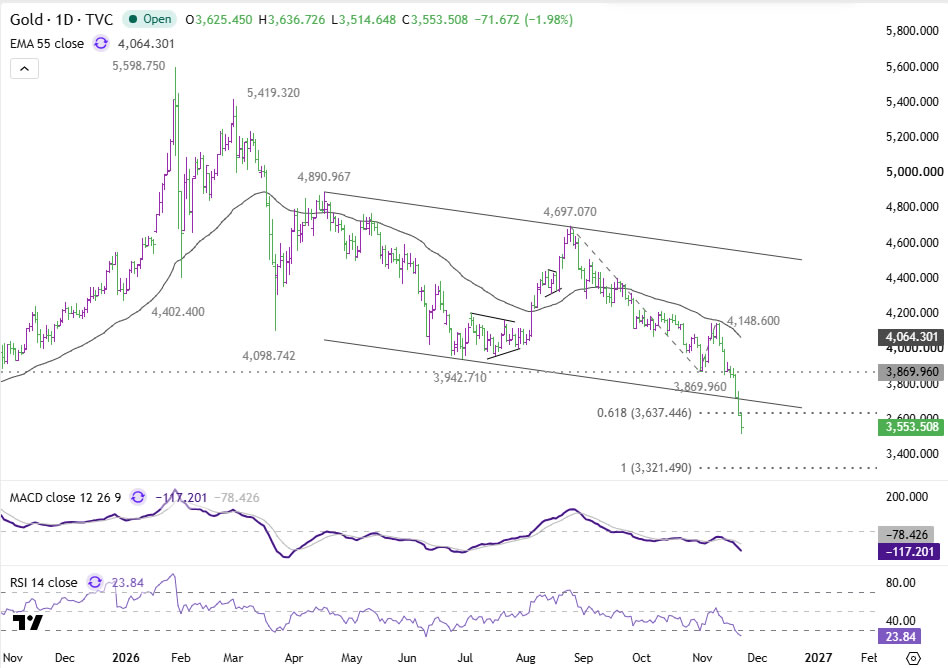
Gold’s technical outlook has deteriorated further following the break below the lower boundary of its medium-term falling channel. The breakdown suggests downside acceleration, with selling momentum strengthening rather than showing signs of stabilization.
Daily RSI has dropped to around 23.8, indicating deeply oversold conditions. Nevertheless, the strength of the current selling momentum means that oversold conditions alone may not be sufficient to slow the decline or establish a bottom.
Near-term outlook will remain firmly bearish as long as 3,869.96 support-turned-resistance holds.
The next downside target is the 100% projection of 4,697.07 to 3,869.96 from 4,148.60 at 3,321.49.
This projection is particularly significant because it almost coincides with a major retracement level on the monthly chart, creating an important potential support area.
Gold Monthly, Long-Term Retracement Breakdown Raises Risk Toward 3,000
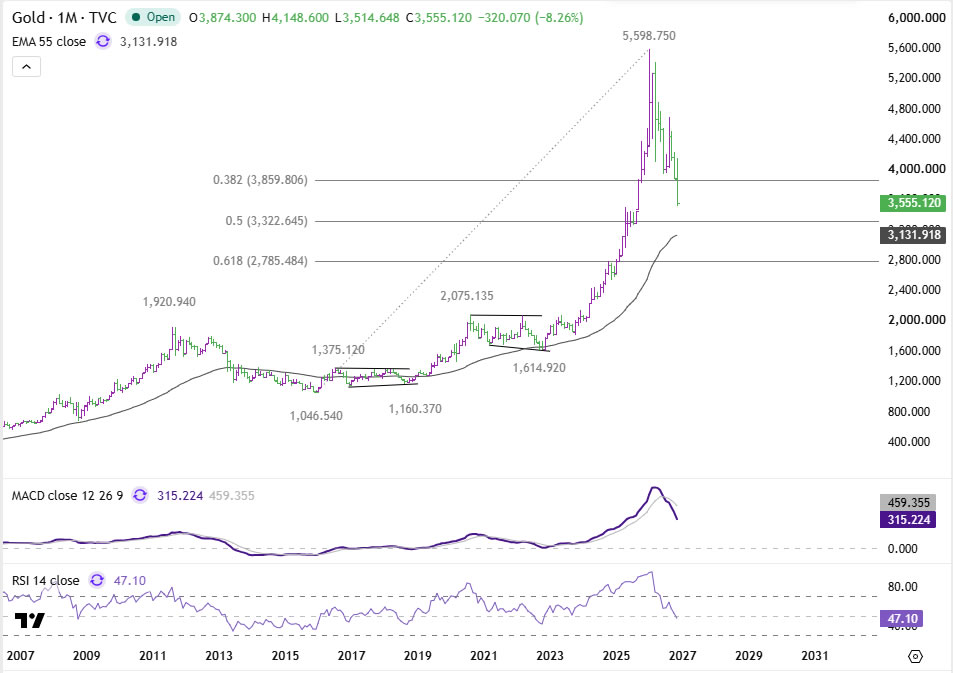
More importantly, gold’s accelerated decline this week has firmly broken the 38.2% retracement of the entire advance from the 2015 low at 1,046.54 to the 2026 high at 5,598.75, located at 3,859.80.
This development suggests that the fall from 5,598.75 is correcting the broader uptrend from 2015, rather than merely the final stage of the preceding rally.
The next possible support area lies between the 50% retracement at 3,322.64 and the 55-month EMA, currently around 3,131.
Notably, the 50% retracement at 3,322.64 is virtually identical to the daily chart’s 100% projection at 3,321.49. This convergence makes 3,321–3,323 the first major technical area to watch for stabilization.
However, given the strength of the current decline, a further selloff toward the psychological 3,000 level cannot be ruled out before gold establishes a more durable bottom.
The distinction between these objectives is important. The 3,321–3,323 area represents the next major downside target, while the 55-month EMA around 3,131 provides additional potential support below it. A sustained decline through these levels would bring the 3,000 psychological threshold into sharper focus.
For now, the technical outlook remains heavily bearish, and there is insufficient evidence that the correction has reached its final stage. The immediate test is whether selling pressure begins to ease as gold approaches the major retracement and projection confluence, or whether continued cross-asset weakness carries the decline toward the deeper long-term support area.
Key Takeaways
- Gold traded around 3,558, down more than 8% on the week and about 36% below its 5,598.75 record, after breaking the 38.2% long-term retracement at 3,859.80.
- The decline began with hawkish Fed repricing, but gold kept falling as the 10-year yield eased about 9bps to around 5.01% and the Dollar held near 103.73.
- Gold lost about 4.1% overnight alongside Wall Street, Nikkei, KOSPI, silver and crypto, consistent with broad risk reduction, though the data do not confirm forced liquidation.
- The 100% projection at 3,321.49 and the 50% retracement at 3,322.64 form the first major support area, with the 55-month EMA near 3,131 and 3,000 below.
- The outlook stays bearish while 3,869.96 holds as resistance, and daily RSI near 23.8 signals deeply oversold conditions that may not stop the decline.
Stay ahead of gold’s slide toward 3,321 and the risk signals that could decide how far it goes—join the ActionForex Telegram channel for regular market updates and analysis.