
Quick overview
- Gold is currently trading at approximately $4,176 after rebounding from a low of $4,073 following a hot US CPI report.
- Kevin Warsh’s neutral comments in Bangkok led to a weakening of the USD and reduced expectations for an October Fed rate hike.
- Gold needs to close above $4,188 to confirm a bullish trend, with potential resistance levels at $4,217 and $4,262.
- Central banks continued to purchase gold, with significant inflows into gold ETFs, despite declining physical demand in China.
On Friday, October 16, Gold was trading at approximately $4,176. This was after Gold rebounded from the low of approximately $4,073 set following the hot US CPI report. There was no signal on the Fed rate path from Kevin Warsh in Bangkok. This led to the USD sliding, and an expectation in the market for an October hike dwindled. Price is currently pushing the $4,188 trendline and moving average on the 4-hour chart. The level at approximately $4,188 will determine the direction for the move, with potential levels at $4,217 and $4,262 to the upside.
My view: neutral to slightly bullish while approximately $4,147 holds. A close above approximately $4,188 on the 4-hour chart would confirm the next leg up.
Warsh Keeps His Cards Close Before the Blackout
At an IMF fireside chat in Bangkok, Warsh repeated his commitment to price stability and didn’t elaborate on the expected path of the fed funds rate. He also said he doesn’t prejudge meetings. The dollar came under renewed selling and gold climbed to around $4,178 after his comments. Mary Daly and Michelle Bowman shared similar views, suggesting an immediate rate hike may not be warranted. The target range is currently 3.75% – 4.00%, after the 0.25 percentage point increase in the federal funds rate announced on September 16.
The Fed enters its blackout period on Saturday with the exception to provide updates for market functioning and integrity. Warsh’s comments were the last major policy signals before the October 27-28 meeting. I think the most interesting aspect of the comments is the change in October and December pricing. October is priced to move about 25% while December is virtually fully priced.
Hot Inflation Hit Gold First, Then Faded
U.S. consumer prices increased 3.7% over the last 12 months (Sept.), outpacing estimates, with gas prices increasing 9.1% in September alone. PPI came in even hotter. The headline PPI climbed 6.3% over the last year, while core PPI increased to 5.0% over the same period. The unexpectedly hot CPI print caused gold prices to retreat toward $4,073, but the metal gained 1.25% as yield and the U.S. dollar reversed lower, pushing it above $4,150.
As mentioned in previous editions, gold is a rate-sensitive asset first and an inflation hedge second for 2026. The 10-year yield fell 10 basis points (10 bp) to 5.089% and the USDX fell 0.45% to 101.99. With long-end yields still above 5%, holding a zero-yielding asset remains costly and explains the recent inability for gold to sustain rallies.
Central Banks and ETFs Kept Buying the Dip
Central banks kept up their purchasing. With another 39 tonnes added in August, central bank purchases year-to-date have reached 170 tonnes, according to the World Gold Council. Among the leading net purchasers were Poland (98 tonnes) and China (80 tonnes). China extended its monthly purchasing streak to 23 months with a purchase of 23 tonnes in September. Russia and Turkey have been the largest net sellers this year, but prices have dropped and China has bought more, indicating a possible strategic purchase.
Declining physical demand in China has been a key negative for gold this quarter. Chinese wholesale demand for gold plummeted 21% year-on-year to 234 tonnes in the third quarter, with weakness in the jewelry industry being the main factor.
Especially interesting was September where $10 billion was invested in gold ETFs, bringing total inflows for the quarter to a record of roughly $31 billion and pushing total holdings to a record high of 4,256 tonnes.
Oil and Iran Cut Both Ways
According to the President, the U.S. will not strike Iran before the November 3 midterms. He considered talks to end the war in the Middle East productive. This week, WTI trades above $95.50. As the war drives energy prices higher, increasing inflation and hawkish Fed expectations, gold loses its appeal. A durable ceasefire, therefore, could lift bullion more than an increase in hostilities.
Gold Technical Analysis: The $4,188 Trendline Is the Test
Gold is currently trading at $4,176.51 on the 4-hour chart after bouncing up from the low of $4,073 on the 14th of October. The broader structure is still bearish with a falling trendline that caps rallies since late September. What I find interesting, is how little space there is above the 4 hour chart before the next major resistance. The golden moving average is at $4,188.39 which converges with the trendline, and the red moving average is at $4,159.57.
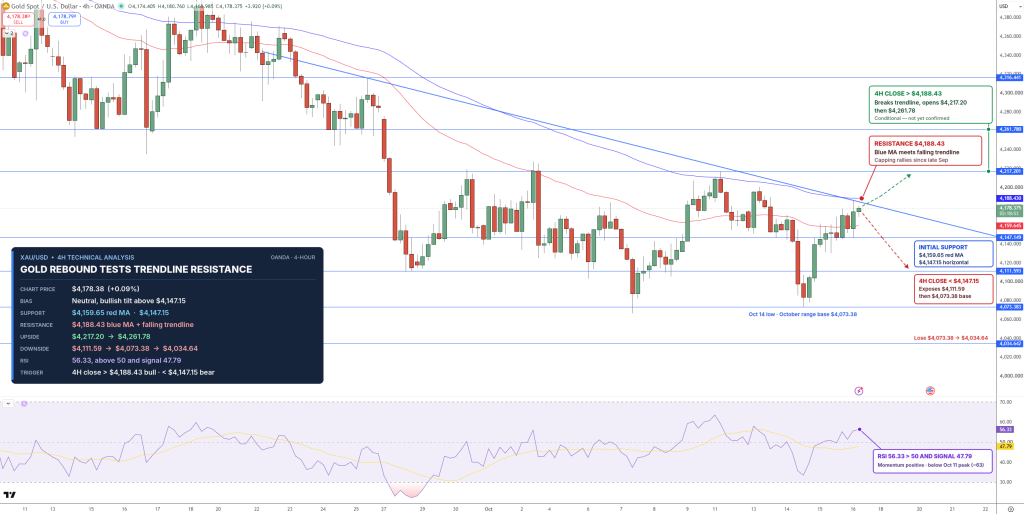
The RSI is at 55.92 with the signal line at 47.76, which means that momentum has turned positive. It is still far from overbought, as it was earlier in the week. A 4 hour close above $4,188 would break the trendline and target $4,217 and $4,262. A daily close above the 100 SMA at $4,245 would be the next major resistance target.
A close below $4,147 would expose the October range lows at $4,111, and $4,073.38. The first strong support is at $4,147, so as long as that holds, I am neutral with a slight bias long. If the 4 hour trendline is tested and rejected, and price closes below the red moving average, I would be bearish.
- Resistance: $4,188.39 | $4,217.20 | $4,261.78
- Support: $4,159.57 | $4,147.15 | $4,111.59 | $4,073.38 | $4,034.64
FAQs
Why is gold rising today?
Gold is rising after Federal Reserve chair, Kevin Warsh, signaled at an IMF fireside chat in Bangkok that he would not prejudge the next rate decision despite the recent CPI and PPI data. As the dollar weakened and Treasury yields fell, odds of an October rate hike fell as well.
What level does gold need to break next?
In the near-term, gold needs to close above $4,188 to break its longer-term trendline. A break above that would target $4,217 and $4,262, with a failure to break keeping $4,147 and $4,073 in play.
Will the Fed raise rates in October 2026?
Just a one in four chance is priced into the market for an October hike, with a December hike all but priced in. The decision is scheduled for Oct. 28.
Meta Title: Gold Price Forecast: XAU/USD Eyes $4,200 After Warsh Stays Neutral
Meta Description: Gold trades near $4,176 as Warsh’s neutral tone weakens the dollar. Can XAU/USD clear the $4,188 trendline and push toward $4,217? Key levels inside.

Arslan Ali Butt
Lead Markets Analyst – Multi-Asset (FX, Commodities, Crypto)
Arslan Ali Butt serves as the Lead Commodities and Indices Analyst, bringing a wealth of expertise to the field. With an MBA in Behavioral Finance and active progress towards a Ph.D., Arslan possesses a deep understanding of market dynamics.
His professional journey includes a significant role as a senior analyst at a leading brokerage firm, complementing his extensive experience as a market analyst and day trader. Adept in educating others, Arslan has a commendable track record as an instructor and public speaker.
His incisive analyses, particularly within the realms of cryptocurrency and forex markets, are showcased across esteemed financial publications such as ForexCrunch, InsideBitcoins, and EconomyWatch, solidifying his reputation in the financial community.