
Quick overview
- Gold prices increased as oil prices fell and the dollar weakened, making gold more affordable for international buyers.
- The U.S. jobs report indicated a rise in nonfarm payrolls and a stable unemployment rate, which keeps the Federal Reserve focused on inflation.
- Central banks and ETFs significantly increased their gold holdings in Q3, while jewelry demand decreased due to high prices.
- Upcoming U.S. inflation data releases on November 10 and 13 will be crucial in determining future gold market trends.
Gold gained on Monday as oil fell and the dollar softened. As Reuters reported, President Donald Trump said he was highly unlikely to order further attacks on Iran while negotiations continued. Cheaper oil could ease inflation pressure and give the Federal Reserve less reason to keep rates high. The weaker dollar also made gold more affordable for buyers overseas.
October’s U.S. jobs report helps explain why a Fed rate increase is still a risk. Nonfarm payrolls rose by 165,000 and unemployment stood at 4.1%. That gives the Fed room to keep its attention on inflation. For gold buyers, higher rates make the interest available on cash more attractive.
Central Banks and ETFs Add Gold in Q3
In its November 3 report, the World Gold Council estimated that central banks and other official institutions added a net 321 tonnes in the third quarter, up 42% year over year. Physically backed gold ETFs added 211 tonnes after outflows in the previous quarter. Jewellery demand fell 17% year over year to 313 tonnes as high prices weighed on buyers. Those figures cover July through September. November flows will be measured separately.
U.S. Inflation Data Due November 10 and 13
The BLS release calendar puts October consumer inflation on November 10 and producer inflation on November 13. Both reports are due at 8:30 a.m. Eastern, or 6:30 p.m. in Pakistan. I’m watching whether inflation eases beyond energy. A softer underlying reading would support gold, while persistent price pressure would keep a Fed rate increase in play despite continued official-sector buying.
Gold Technical Analysis: Trendline Retest Holds as $4,139.272 Comes Into Focus
Gold trades near $4,124.410 on the four-hour TVC chart after rebounding from $4,041.877 and retesting the descending trendline from above. The retest gives buyers a support level to work with, but they still need to clear $4,139.272.
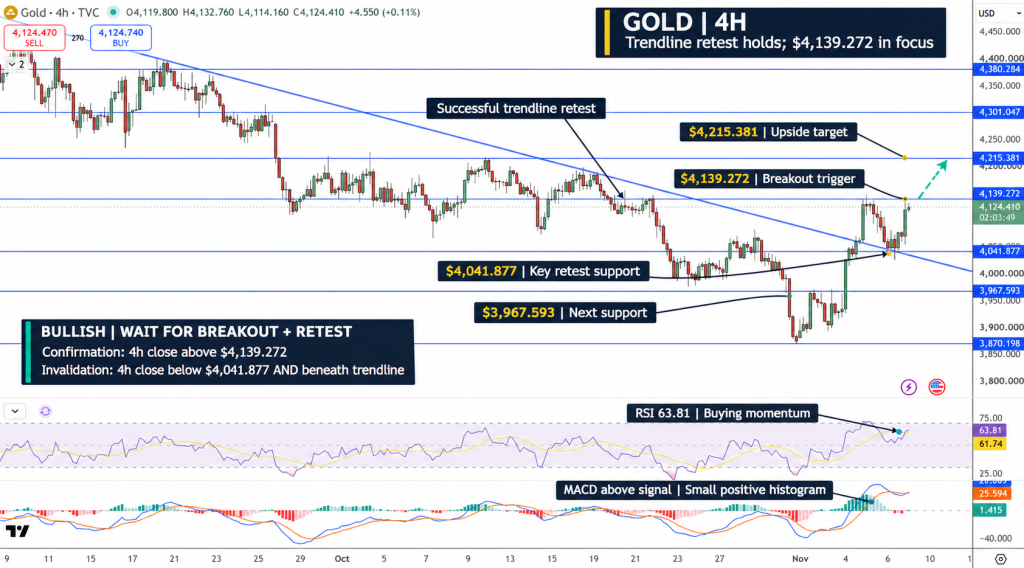
A four-hour close above $4,139.272 would strengthen the recovery toward $4,215.381. Initial support sits at $4,041.877, followed by $3,967.593 if the breakout fails.
The Relative Strength Index (RSI) at 63.81 supports buying momentum. MACD has edged above its signal line, with a small positive histogram. I’m bullish and would favour a close above $4,139.272 followed by a retest that holds. A four-hour close below $4,041.877 and back beneath the trendline would invalidate that view.

Arslan Ali Butt
Lead Markets Analyst – Multi-Asset (FX, Commodities, Crypto)
Arslan Ali Butt serves as the Lead Commodities and Indices Analyst, bringing a wealth of expertise to the field. With an MBA in Behavioral Finance and active progress towards a Ph.D., Arslan possesses a deep understanding of market dynamics.
His professional journey includes a significant role as a senior analyst at a leading brokerage firm, complementing his extensive experience as a market analyst and day trader. Adept in educating others, Arslan has a commendable track record as an instructor and public speaker.
His incisive analyses, particularly within the realms of cryptocurrency and forex markets, are showcased across esteemed financial publications such as ForexCrunch, InsideBitcoins, and EconomyWatch, solidifying his reputation in the financial community.