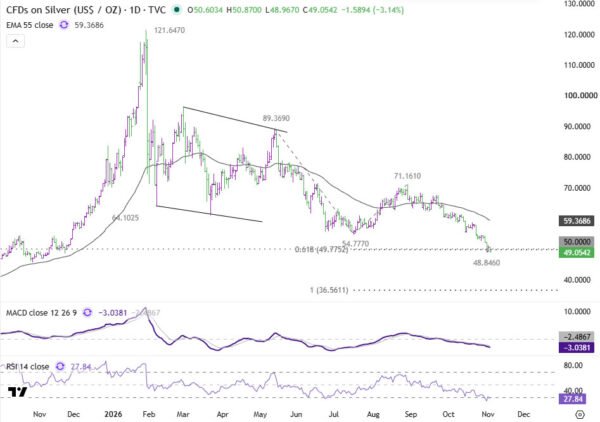
TL;DR: Silver is falling more than 3% today, erasing Monday’s entire recovery, while oil, Treasury yields and the Dollar offered little explanation. The Gold/Silver ratio surged toward 80 (79.6), and weakness in Nasdaq, Asian tech shares and copper points to broader risk reduction, though the link remains unconfirmed.
Why Is Silver Falling When Oil, Yields and the Dollar Are Not Driving It?
Silver is back below $50, and this time the usual explanations are not particularly convincing. Oil has rebounded, US Treasury yields are barely moving, and the Dollar is slightly weaker. Yet silver has erased Monday’s entire recovery, falling around 3.1% to $49.05 while Gold has lost less than 1%. The Gold/Silver ratio has consequently surged toward 80, exposing an increasingly sharp divide between the two precious metals.
The more revealing developments may be occurring outside the metals market. A sharp reversal in Nasdaq on Monday, renewed concerns over the financing of enormous AI infrastructure investments, and heavy selling in Asian technology shares have coincided with weakness in silver and copper. The pattern raises the possibility that broader risk reduction continues to spill into commodities, with silver’s industrial exposure making it more vulnerable than Gold.
That connection remains an interpretation rather than a confirmed explanation. But it offers a useful framework for understanding why silver is struggling to defend $50 even without a fresh surge in oil, yields or the Dollar.
Follow Silver, the Gold/Silver ratio and the AI risk story on the ActionForex Telegram channel.
One Day Was Enough to Erase Silver’s Recovery
Monday had offered precious-metals investors some relief.
WTI crude fell sharply amid reports of renewed US-Iran diplomatic activity, helping ease concerns about another escalation in energy-driven inflation. Silver recovered from Friday’s close near $49.11 to finish around $50.64, while Gold rebounded toward $3,947.
The improvement did not last.
By Tuesday, silver had fallen back toward $49.05, effectively surrendering the entire previous day’s advance. Gold also retreated to approximately $3,909, but its smaller decline left part of Monday’s recovery intact.
At first glance, the renewed selling might appear to be another response to inflation concerns or expectations of tighter monetary policy. Yet the accompanying market movements do not fit that explanation particularly well.
WTI recovered to around $98.02, up from Monday’s close near $96.25, although still substantially below Friday’s $102.94 level. The US 2-year Treasury yield was little changed near 4.594%, while the 10-year hovered around 4.917%. The Dollar Index slipped to approximately 101.67.
- WTI crude: around $98.02, up from $96.25 on Monday but below $102.94 on Friday.
- US 2-year Treasury yield: little changed near 4.594%.
- US 10-year Treasury yield: around 4.917%.
- Dollar Index: slipped to approximately 101.67.
Silver was selling off aggressively without the corresponding rise in US yields or Dollar strength that would typically strengthen a monetary-tightening explanation.
Oil’s recovery also complicates the picture. Lower energy prices may have helped precious metals rebound on Monday, but Tuesday’s silver decline was far larger than the partial reversal in crude would readily explain.
The contrast is even clearer across metals. Copper was down around 2.7%, platinum about 1.1%, and Gold less than 1%. Silver’s decline of more than 3% placed it among the weakest performers.
- Silver: down more than 3%.
- Copper: down around 2.7%.
- Platinum: down about 1.1%.
- Gold: down less than 1%.
This does not exclude an influence from oil or interest rates. However, the relative movements point toward pressure extending beyond the traditional inflation-and-yields channel.
And the most obvious additional source of concern is the renewed deterioration in technology-sector sentiment.
From Nasdaq’s Reversal to Questions About AI Financing
Monday’s US equity session began with renewed optimism around technology shares.
Nasdaq initially gained approximately 0.7%, supported by an early recovery in major AI-related stocks. But the advance unravelled as the session progressed, leaving the index down 1.07% at 25,164.32 by the close.
The reversal was significant not simply because technology shares fell, but because the selling coincided with fresh questions about how the AI investment boom will be financed.
Oracle became a focal point after announcing plans to raise $20 billion through a combination of common stock and senior notes to fund its AI infrastructure expansion. Its shares fell approximately 6% as investors considered the financial implications of the company’s capital requirements.
The announcement brought a familiar concern back into focus: the AI boom may be generating strong demand for computing power, but sustaining the infrastructure build-out requires extraordinary amounts of capital.
As more companies seek financing simultaneously, investors and lenders face growing questions about concentration risk, borrowing capacity and the balance between future returns and near-term funding needs.
Those concerns were echoed by major institutional investors. Blackstone’s Jon Gray emphasized the need for more equity capital to support AI investment as lenders become increasingly conscious of their exposures. Pimco’s Emmanuel Roman also raised concerns about the scale of financing commitments accumulating around the sector.
None of these observations establishes that an AI financing crisis is underway. Demand for computing infrastructure remains strong, and the availability of funding has not disappeared.
But the market is increasingly examining the financing side of the investment boom rather than focusing exclusively on its earnings potential.
The weakness subsequently reached Asia. South Korea’s KOSPI fell approximately 3.6% on Tuesday, reversing Monday’s advance as technology shares came under renewed pressure.
For silver, the relevance lies in its unusual position between a monetary precious metal and an industrial commodity.
Gold can attract defensive demand during periods of uncertainty, although it is not immune to liquidation. Silver, by contrast, combines precious-metal characteristics with substantial exposure to industrial demand and the broader investment cycle.
That combination can make silver particularly vulnerable when investors become concerned about growth, financing conditions or the sustainability of risk-sensitive investments.
The simultaneous weakness in Nasdaq, Asian technology equities, copper and silver is consistent with a broader reduction in risk exposure.
It is not, however, proof that AI-related selling is directly driving silver lower. Futures-positioning data, ETF flows and other evidence of forced liquidation would be needed to establish that connection.
The timing also leaves room for alternative interpretations. Gold and Silver continued recovering during Monday’s US session even as Nasdaq reversed. Their renewed weakness became more apparent during Asian trading on Tuesday, suggesting either a delayed response to equity-market stress or that Monday’s sharp decline in oil temporarily masked other pressures.
The evidence points toward an emerging cross-market connection, but its precise transmission remains uncertain.
Gold/Silver Ratio Is Sending a Clearer Relative-Performance Signal
While the cause of silver’s decline remains open to interpretation, its underperformance against Gold is unmistakable.
The Gold/Silver ratio climbed approximately 2.3% to around 79.6 on Tuesday and has gained roughly 7% over the past week.
A rising ratio means more ounces of silver are required to equal the value of one ounce of Gold. In practical terms, it shows that Gold is outperforming Silver.
That can happen when Gold rises more quickly, but the latest move reflects the opposite situation: both metals are under pressure, and silver is falling much faster.
This is consistent with the different roles of the two metals. Gold has retained relatively stronger defensive characteristics, while silver’s industrial and market-risk exposure appears to be amplifying its losses.
The approaching 80 level is therefore important for more than technical reasons. It provides a convenient measure of whether the current selling pressure continues to fall disproportionately on silver.
A sustained break above 80, especially alongside a decisive silver breakdown through $50, would strengthen the evidence of continuing relative weakness.
There is, however, a technical warning against assuming an uninterrupted move. The ratio’s rapid advance has pushed momentum indicators into overbought territory, making a temporary pause or retracement possible.
The distinction between relative and absolute performance is also important. Even if the Gold/Silver ratio retreats, silver could continue falling if Gold begins weakening more rapidly.
The Next Test Comes From AI Earnings and US Event Risk
Several developments over the coming sessions could help determine whether the recent selling reflects a temporary bout of risk aversion or something more persistent.
AMD and Super Micro are scheduled to report earnings after Tuesday’s US close. Their results and market reception will provide an immediate test of investor confidence in AI-related investment, particularly following the renewed scrutiny of financing requirements.
A strong earnings response and recovery in technology equities could ease pressure on growth-sensitive assets. Conversely, additional disappointment or concerns about funding could reinforce the pattern seen in silver, copper and Asian technology shares.
US midterm election results will introduce a separate source of uncertainty, while Friday’s employment report could shift the market’s attention back toward Federal Reserve policy expectations.
That creates two possible channels for the next substantial move in silver.
One involves continued pressure on technology equities and broader risk-sensitive assets, potentially reinforcing silver’s relative underperformance.
The other involves changes in Treasury yields, the Dollar and rate expectations following US economic data, which could restore a more conventional monetary-policy influence on precious metals.
Until those developments clarify the picture, the technical response around $50 will be especially important.
ActionForex’s Technical View: Silver, the Battle Around $50 Is Not Yet Settled
Daily Chart — The Larger Bearish Trend Remains Intact
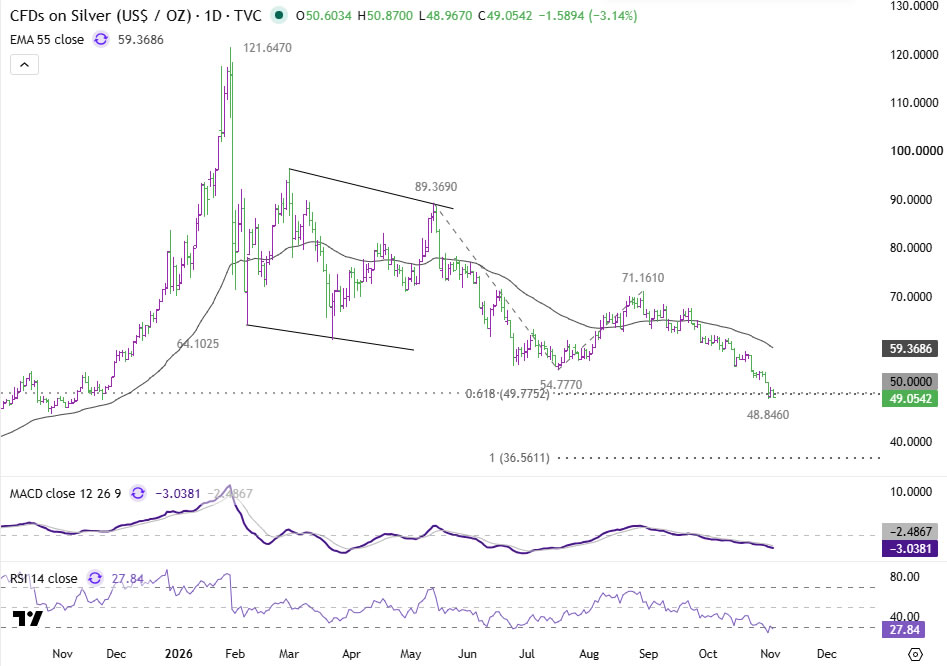
Silver’s decline from 89.37 remains in progress, with the metal continuing to trade well below its falling 55-day EMA near 59.37.
The most important immediate support is the psychologically significant $50 region, which nearly coincides with the 61.8% projection of 89.37 to 54.77 from 71.16 at approximately 49.77.
Silver has already traded below that area, but the price action has yet to establish a decisive and sustained breakdown.
That distinction matters because the region could still attract buying interest after the sharp decline. Daily RSI near 27.8 indicates oversold conditions, leaving room for temporary stabilization.
However, a sustained break through the $50 support region would materially strengthen the bearish outlook, potentially opening the way toward the 100% projection at 36.56.
The falling daily MACD and continued trading below the 55-day EMA suggest that a short-term recovery, if it develops, would not by itself reverse the broader bearish structure.
4-Hour Chart — 48.84 Is the Immediate Downside Trigger
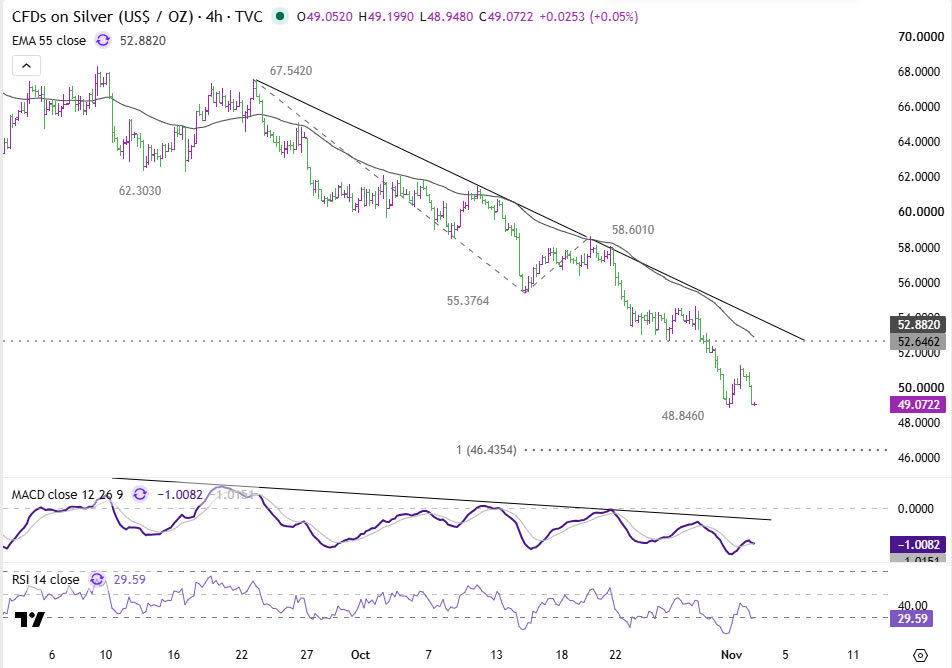
The 4-hour chart provides a more immediate test of whether selling pressure is extending.
Silver’s recovery attempts from 48.84 have remained well below the declining 55-period EMA around 52.88, while the descending trendline continues to cap the broader short-term structure.
The recent decline is therefore still regarded as in progress.
A break below 48.84 would confirm another extension lower and target the 100% projection of 67.54 to 55.37 from 58.60 at 46.43.
On the upside, a firm break above 52.64 support-turned-resistance would offer the first indication that a short-term bottom may be forming. Such a move could open the way for a stronger rebound toward 55.37.
The 4-hour RSI near 29.6 warns that selling may be temporarily stretched. Nevertheless, the immediate outlook will remain bearish unless silver can reclaim its nearby resistance levels.
ActionForex’s Technical View: Gold/Silver Ratio, Is 80 the Gateway to Further Gains?
Daily Chart — Uptrend Targets the 84.5 Area
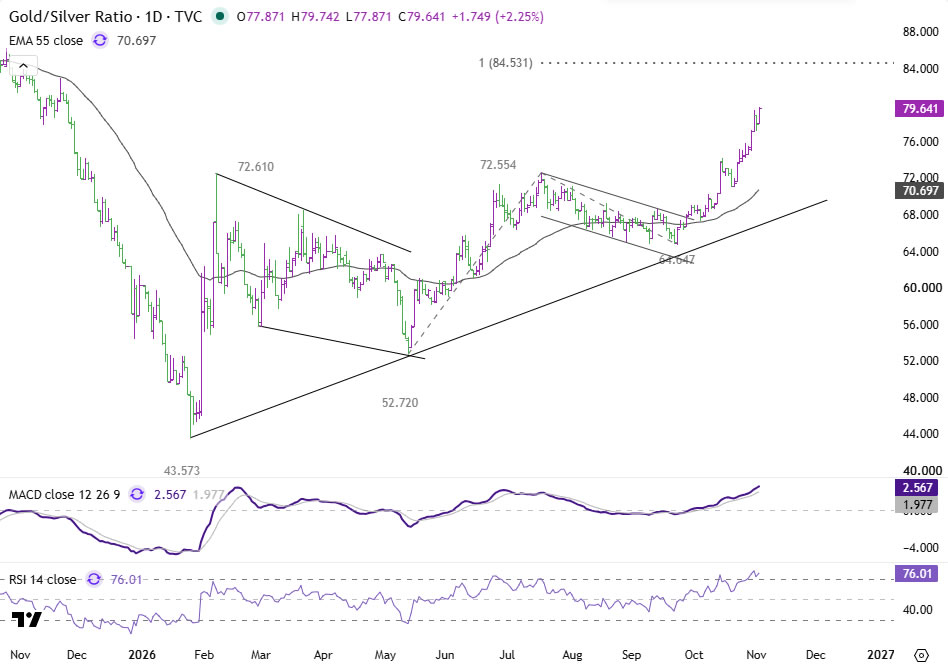
The Gold/Silver ratio’s advance has resumed after a brief retreat, extending the rally from 64.64 toward 80.
The ratio is trading comfortably above its rising 55-day EMA near 70.70, while daily MACD continues to support the bullish structure.
A sustained break above 80 would strengthen the prospect of further gains toward the 100% projection of 52.72 to 72.55 from 64.64, around 84.5.
Such a move would indicate continued Gold outperformance, potentially accompanied by further silver weakness if the current market pattern persists.
However, daily RSI around 76 signals overbought conditions. The ratio may therefore consolidate or retreat temporarily before attempting another substantial advance.
4-Hour Chart — 77.07 Holds the Key to Near-Term Momentum
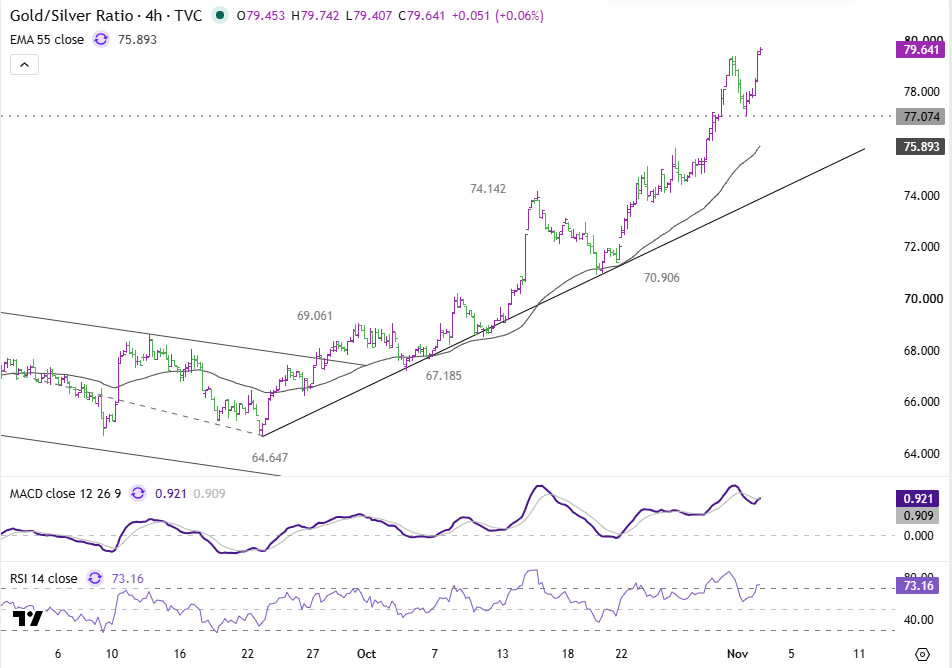
The 4-hour structure remains firmly bullish, with the ratio maintaining a sequence of higher highs and higher lows.
Further rise is favoured while 77.07 support holds, keeping a sustained break above 80 and a potential extension toward 84.5 in focus.
A break below 77.07 would instead indicate a short-term top and suggest that silver’s relative underperformance is beginning to ease.
This would not necessarily mark a bottom in silver itself. Rather, it would signal a change in the balance of performance between Gold and Silver, which could occur even if both metals continue declining.
Is Silver’s Weakness Warning of Broader Market Stress?
Silver’s return below $50 is significant not only because of the technical level involved, but because of the market environment in which the decline is occurring.
The usual macroeconomic explanations are incomplete. Oil has partially recovered, Treasury yields are stable and the Dollar is slightly softer. Yet silver has lost the entire previous day’s rebound while technology equities and industrial metals have also weakened.
That pattern is consistent with risk reduction spreading beyond the AI sector, particularly as investors reassess the capital requirements of the technology investment boom.
However, the evidence does not yet justify treating AI-related liquidation as the established cause of silver’s decline. The next corporate earnings reports, equity-market reaction and positioning data will be important in testing the explanation.
Technically, the immediate focus remains on whether silver can defend the $50 region and the recent low at 48.84. A break would expose 46.43, while a decisive failure of the broader daily support structure would increase the risk of a much deeper decline.
At the same time, the Gold/Silver ratio is approaching 80, with a sustained breakout potentially opening the way toward 84.5.
The combination of silver losing support and the Gold/Silver ratio accelerating higher would be a stronger warning than either development alone.
For now, silver’s technical outlook remains bearish, and its relative weakness against Gold is becoming increasingly pronounced. Whether that reflects a temporary adjustment in risk appetite or a broader liquidation process remains the central question for the coming sessions.
Key Takeaways
- Silver fell about 3.1% to $49.05 on Tuesday, erasing Monday’s recovery to $50.64, while Gold lost less than 1%.
- WTI, the US 2-year yield (near 4.594%) and the Dollar Index (around 101.67) offer little explanation, pointing toward broader risk reduction alongside Nasdaq (−1.07% on Monday), KOSPI (−3.6%) and copper (−2.7%).
- The Gold/Silver ratio climbed about 2.3% to around 79.6 and is up roughly 7% in a week; a sustained break above 80 targets about 84.5.
- Silver’s immediate downside trigger is 48.84, which would target 46.43, while the daily chart’s next objective is 36.56 on a sustained break of the $50 region.
- AMD and Super Micro earnings after Tuesday’s close, US midterm results and Friday’s employment report are the next tests.