TL;DR: EUR/JPY and AUD/JPY have broken key technical support this week, but the weekly performance breakdown shows only 0.1–0.3 percentage points of that weakness comes from genuine Yen strength—the rest reflects Dollar and Yen as the two strongest majors, with intervention risk capping USD/JPY and forcing Euro, Aussie, Sterling and Kiwi weakness to pass directly into their Yen crosses.
Why This Matters
When several Yen crosses break support in the same week, the reflexive read is a broad Yen rally. But cross rates are arithmetic, not sentiment, and the underlying math this week tells a more specific story: Yen is not surging broadly, it is being held up by an intervention ceiling on one specific pair. That distinction matters directly for how far EUR/JPY and AUD/JPY can fall, and it hands traders a clean diagnostic—USD/JPY itself—for telling a contained cross-driven move apart from the start of a genuine Yen rally.
It Looks Like a Yen Rally, but the Arithmetic Says Otherwise
EUR/JPY and AUD/JPY have both broken important technical support this week. GBP/JPY and NZD/JPY have weakened alongside them. At first glance, the price action looks like a broad Yen rally. But the weekly performance breakdown tells a more specific story.
EUR/USD is down around -0.91%, compared with a -1.04% decline in EUR/JPY. AUD/USD has fallen roughly -1.82%, while AUD/JPY is down -1.97%. The same pattern extends to Sterling and Kiwi: GBP/USD is down around -0.69% versus -0.98% in GBP/JPY, while NZD/USD has fallen -1.12% against -1.41% in NZD/JPY.
That means only around 0.1 to 0.3 percentage point of the weakness in those Yen crosses reflects additional Yen appreciation beyond what is already happening against the Dollar. USD/JPY itself is almost unchanged on the week. The real picture is therefore that Dollar and Yen are the two strongest major currencies, while Euro, Aussie, Sterling and Kiwi are losing ground against both.
That raises the more interesting question: why is that relative strength producing outright breakdowns in EUR/JPY and AUD/JPY while USD/JPY itself is barely moving?
Dollar Strength Survives a Collapse in October Hike Odds
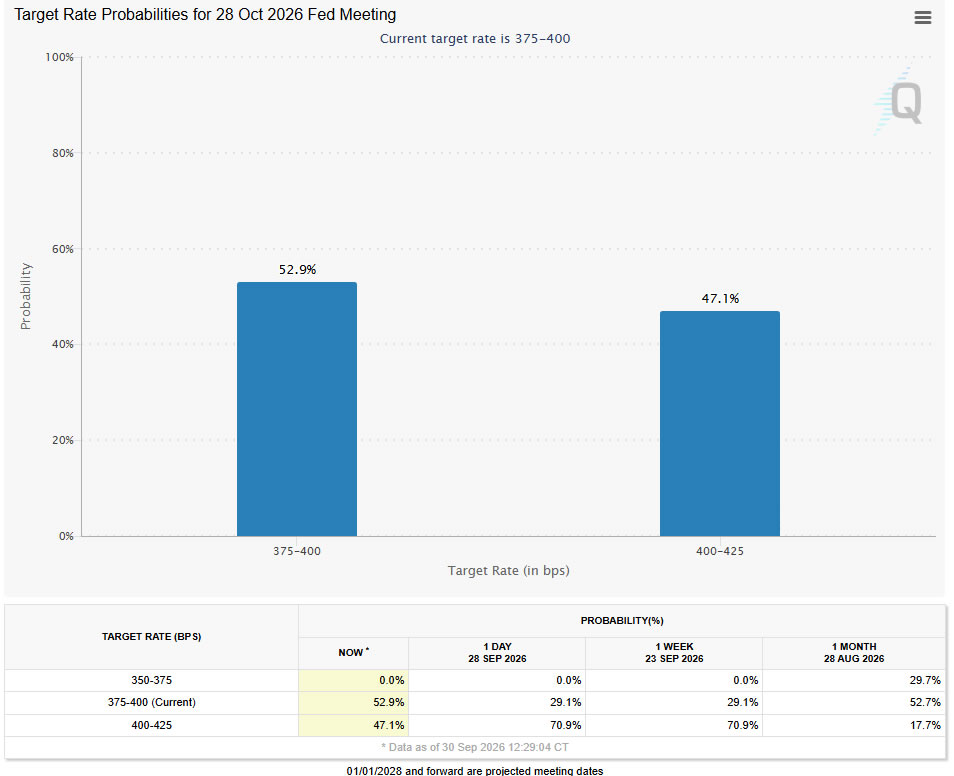
The Dollar side of the equation is particularly notable because one of its recent supports has weakened sharply. CME FedWatch pricing now puts the probability of an October Fed hike at around 47%, down from roughly 71% a day earlier. The shift followed New York Fed President John Williams’ remarks in Buffalo on Tuesday. Williams said there was “no need for urgency” after September’s rate increase and that, if the economy develops broadly in line with his forecast, one further hike may be appropriate “late this year.”
That has turned October from something markets were leaning toward heavily into something much closer to a coin flip. But it has not produced a corresponding collapse in the Dollar.
Part of the reason is that Williams’ message was about timing, not an outright rejection of further tightening. Federal Reserve Governor Michael Barr continued to argue that further policy adjustments are likely to be required, while Chicago Fed President Austan Goolsbee warned that keeping inflation above target for so long was “playing with fire.”
More importantly, U.S. Treasury yields remain historically elevated even after easing from their latest highs. The 10-year yield reached its highest level since 2007 this week, while the broader bond selloff has kept U.S. yields high enough to preserve substantial structural support for the Dollar. So the Dollar story has changed, but not reversed: the market has lost conviction that the next Fed hike must come in October, but it has not lost the high-yield environment that made the Dollar attractive in the first place.
Yen Strength Comes From an Intervention Ceiling
The Yen is being supported by a very different mechanism. The BOJ raised its policy rate to 1.25% on September 18, the highest in 31 years. But the Yen did not respond with a sustained rally because Governor Kazuo Ueda stopped short of delivering a clearly accelerated tightening path, while two board members dissented from the hike.
What changed subsequently was the intensity of the currency-policy warning. U.S. President Donald Trump raised concern over Yen weakness directly with Japanese Prime Minister Sanae Takaichi during their September meeting. Finance Minister Satsuki Katayama subsequently said both governments shared concerns about the Yen’s undervaluation, while Katayama and U.S. Treasury Secretary Scott Bessent agreed to maintain close communication on foreign exchange. Those exchanges came after coordinated U.S.-Japan Yen-buying intervention earlier in the year. Japan’s top currency diplomat Atsushi Mimura then reinforced the message on Monday, telling markets to take the “very clear” warning from Tokyo and Washington “at face value.”
That history makes the current jawboning harder to dismiss as routine rhetoric. But the effect so far is more specific than a generalized surge in Yen demand—it is acting as a ceiling over USD/JPY. And that distinction explains what is happening in the crosses.
Why Intervention Risk Hits the Crosses Harder
Cross rates are arithmetic. EUR/JPY can be expressed through EUR/USD and USD/JPY, and the same relationship applies to AUD/JPY, GBP/JPY and NZD/JPY.
In a conventional broad-Dollar rally, the two legs partially offset each other. Suppose EUR/USD falls because the Dollar strengthens: under normal circumstances, that same broad Dollar strength would also lift USD/JPY, cushioning the decline in EUR/JPY. This week, that cushion is largely absent. Intervention risk is preventing USD/JPY from participating fully in the Dollar’s wider advance—the Dollar can strengthen sharply against Euro, Aussie, Sterling and Kiwi without making comparable progress against Yen. The weakness in those currencies therefore passes much more directly into their Yen crosses.
That is why EUR/JPY can break lower even though USD/JPY is barely moving, and why AUD/JPY can suffer an even sharper decline when Aussie is already under independent pressure following the RBA and Governor Michele Bullock’s cautious guidance. The key mechanism is therefore not that intervention risk is generating enormous standalone Yen demand—it is that intervention risk is removing the offset that would normally cushion Yen crosses during a broad Dollar rally.
ActionForex’s Technical View on EUR/JPY, AUD/JPY and USD/JPY
EUR/JPY Heads Toward the 175.26–175.41 Test
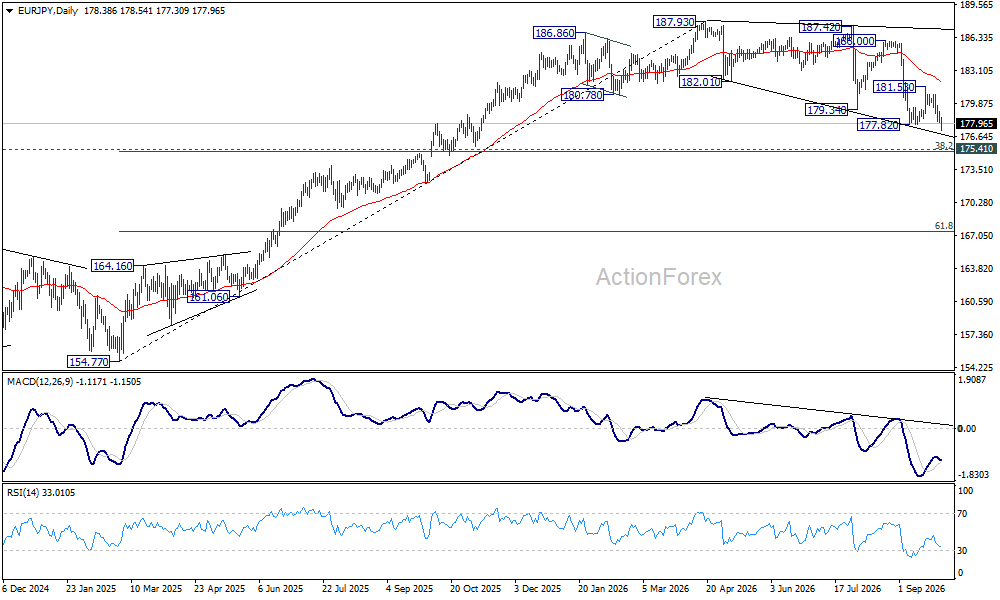
The technical picture in EUR/JPY fits that mechanism closely.
The break of 177.82 support argues that the decline from 187.93 has resumed. Near-term risk therefore remains on the downside while 181.53 resistance holds.
But the larger fall can still be treated as a correction of the medium-term rally from 154.77 to 187.93, rather than a confirmed trend reversal.
The key test is the 175.26–175.41 support zone.
The 175.26 level represents the 38.2% retracement of the 154.77–187.93 advance, while 175.41 corresponds closely with the 2025 high. That makes the area an important technical confluence where a stronger rebound could emerge.
A sustained recovery above 181.53 would be the first meaningful indication that a short-term bottom has formed.
A decisive break through 175.26–175.41, however, would materially weaken the medium-term structure and increase the risk that the decline has become more than a correction. In that case, the 167.44 area, the 61.8% retracement of the same advance, would become the next major downside reference.
AUD/JPY Has the Cleaner Bearish Structure
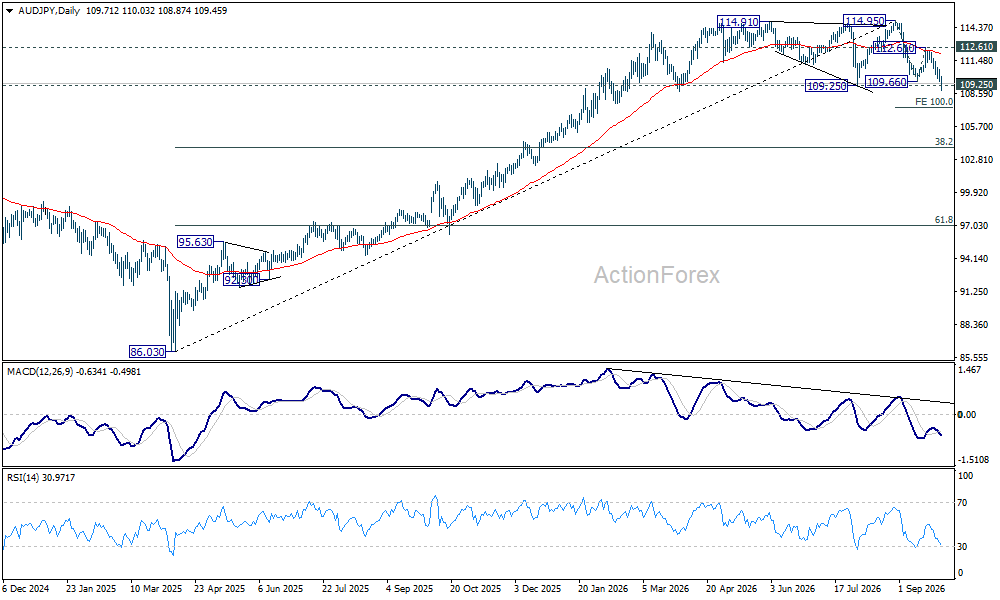
AUD/JPY is technically more vulnerable.
The decline from 114.95 resumed with the break of 109.66, while the subsequent loss of 109.25 confirms that the correction is now retracing the much larger advance from 86.03.
The bearish case is also reinforced by the pair’s earlier rejection from the daily 55 EMA.
The next downside objective is around 107.32, representing the 100% projection of the 114.95–109.66 decline measured from 112.61.
A firm break there would expose 103.90, the 38.2% retracement of the entire 86.03–114.95 rally.
Any rebound should remain corrective while 112.61 resistance holds.
That gives AUD/JPY a cleaner downside structure than EUR/JPY, while the fundamental backdrop also reinforces it: Aussie is absorbing both broad Dollar strength and its own post-RBA repricing at the same time that intervention risk is preventing USD/JPY from providing an offset.
USD/JPY Is the Control Chart
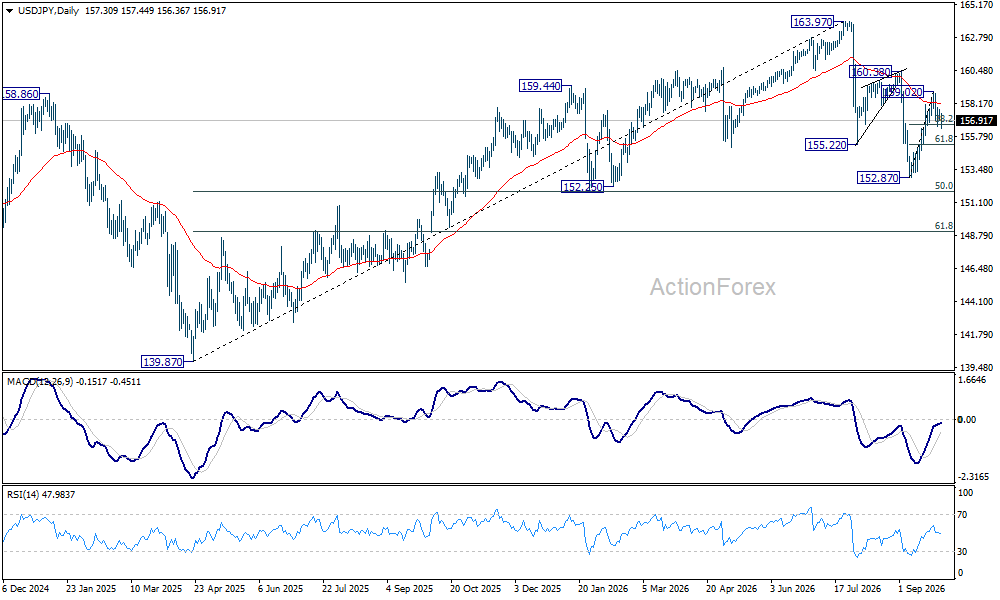
USD/JPY is the most important chart for deciding whether this interpretation remains valid.
The pair has retreated from 159.02, but the decline has so far looked more like a corrective pullback than a renewed collapse from the larger 163.97 high.
Price is now testing the 156.67 area, corresponding to the 38.2% retracement of the rebound from 152.87 to 159.02.
If that support holds and USD/JPY turns higher, the intervention-cap interpretation remains intact. Officials may be limiting the Dollar’s upside against Yen, but they have not yet produced a decisive bearish reversal.
A recovery through 159.02 would strengthen that view and reopen 160.38.
By contrast, sustained weakness through the current support area would begin to signal something broader than an intervention-constrained Dollar rally. A break back through 152.87 would materially weaken the rebound structure and expose 151.92, around the 50% retracement of the larger rise from 139.87 to 163.97.
That creates a useful diagnostic:
- If USD/JPY holds while EUR/JPY and AUD/JPY continue falling, the relative-strength mechanism remains intact.
- If USD/JPY itself starts breaking major support, then the story is becoming a genuine broader Yen rally.
When Does This Become a Real Yen Rally?
The technical picture currently mirrors the fundamental thesis unusually well. EUR/JPY and AUD/JPY have both broken important support and are carrying weak momentum. USD/JPY, by contrast, remains caught between a strong Dollar backdrop and increasingly credible Japanese intervention warnings, leaving the Yen crosses to absorb most of the adjustment. For EUR/JPY, 175.26–175.41 is the next major structural test; for AUD/JPY, the immediate focus is 107.32, with 103.90 becoming vulnerable if the correction extends.
But USD/JPY remains the control chart. As long as it holds around the current support structure, the breakdown in Yen crosses can still be understood primarily as weak Euro, Aussie and other currencies being transmitted through a USD/JPY pair capped by intervention risk. A sustained USD/JPY break lower would change that conclusion. Until then, the crosses may look like they are leading a broad Yen rally. The arithmetic says they are mostly revealing what happens when Dollar strength has nowhere to go against Yen.
Key Takeaways
- Only 0.1–0.3 percentage points of this week’s EUR/JPY, AUD/JPY, GBP/JPY and NZD/JPY weakness reflects genuine Yen strength beyond what’s already priced against the Dollar.
- October Fed hike odds fell to 47% from 71% after Williams’ remarks, but elevated Treasury yields have kept the Dollar’s structural support intact.
- Japan’s intensifying intervention warnings, from Trump-Takaichi talks through diplomat Atsushi Mimura, are capping USD/JPY specifically rather than lifting Yen broadly.
- That cap removes the usual offset in Yen crosses, so Euro, Aussie, Sterling and Kiwi weakness passes more directly into EUR/JPY and AUD/JPY.
- USD/JPY is the key diagnostic: holding support near 156.67 keeps this a cross-driven story, while a break below 152.87 would signal a genuine broad Yen rally.