Reports of the week:
-
GameDiscoverCo: AI and Game Engines at the October 2026 Steam Next Fest
-
Newzoo & G2A.COM: How Players Buy Games on PC and Console in 2026
-
Playgama: Which AI Agents and Models Make Web Games that People Play
-
Xsolla: Mobile Game Web Shops in 2026

GameDiscoverCo collected AI disclosures from demo pages at the October 2026 Steam Next Fest and categorized them with Claude. GameDiscoverCo identified game engines in the files of almost every demo at the festival.
-
The October 2026 Steam Next Fest had over 7,000 demos. That’s 40% more than GameDiscoverCo expected based on previous festivals (around 5,000).

If a contractor drew it, the answer depends on the contract — and without one, it might not be you. Mellow contracts cover IP rights and NDAs from day one, so every asset belongs to your studio and your project stays confidential. Payments and compliance run in the same flow.
-
2,517 demos (34.4%) disclosed AI use on their Steam pages. At the February 2026 festival, 750 (21.2%) disclosed AI use; in June, 1,163 (26.5%).
❗️In the How To Market A Game recap, the numbers are slightly different: 2,502 games (34.6%), with art and visuals accounting for 75.7% of disclosures. The difference comes from Chris Zukowski’s data being from October 21 and a different AI disclosure methodology.
-
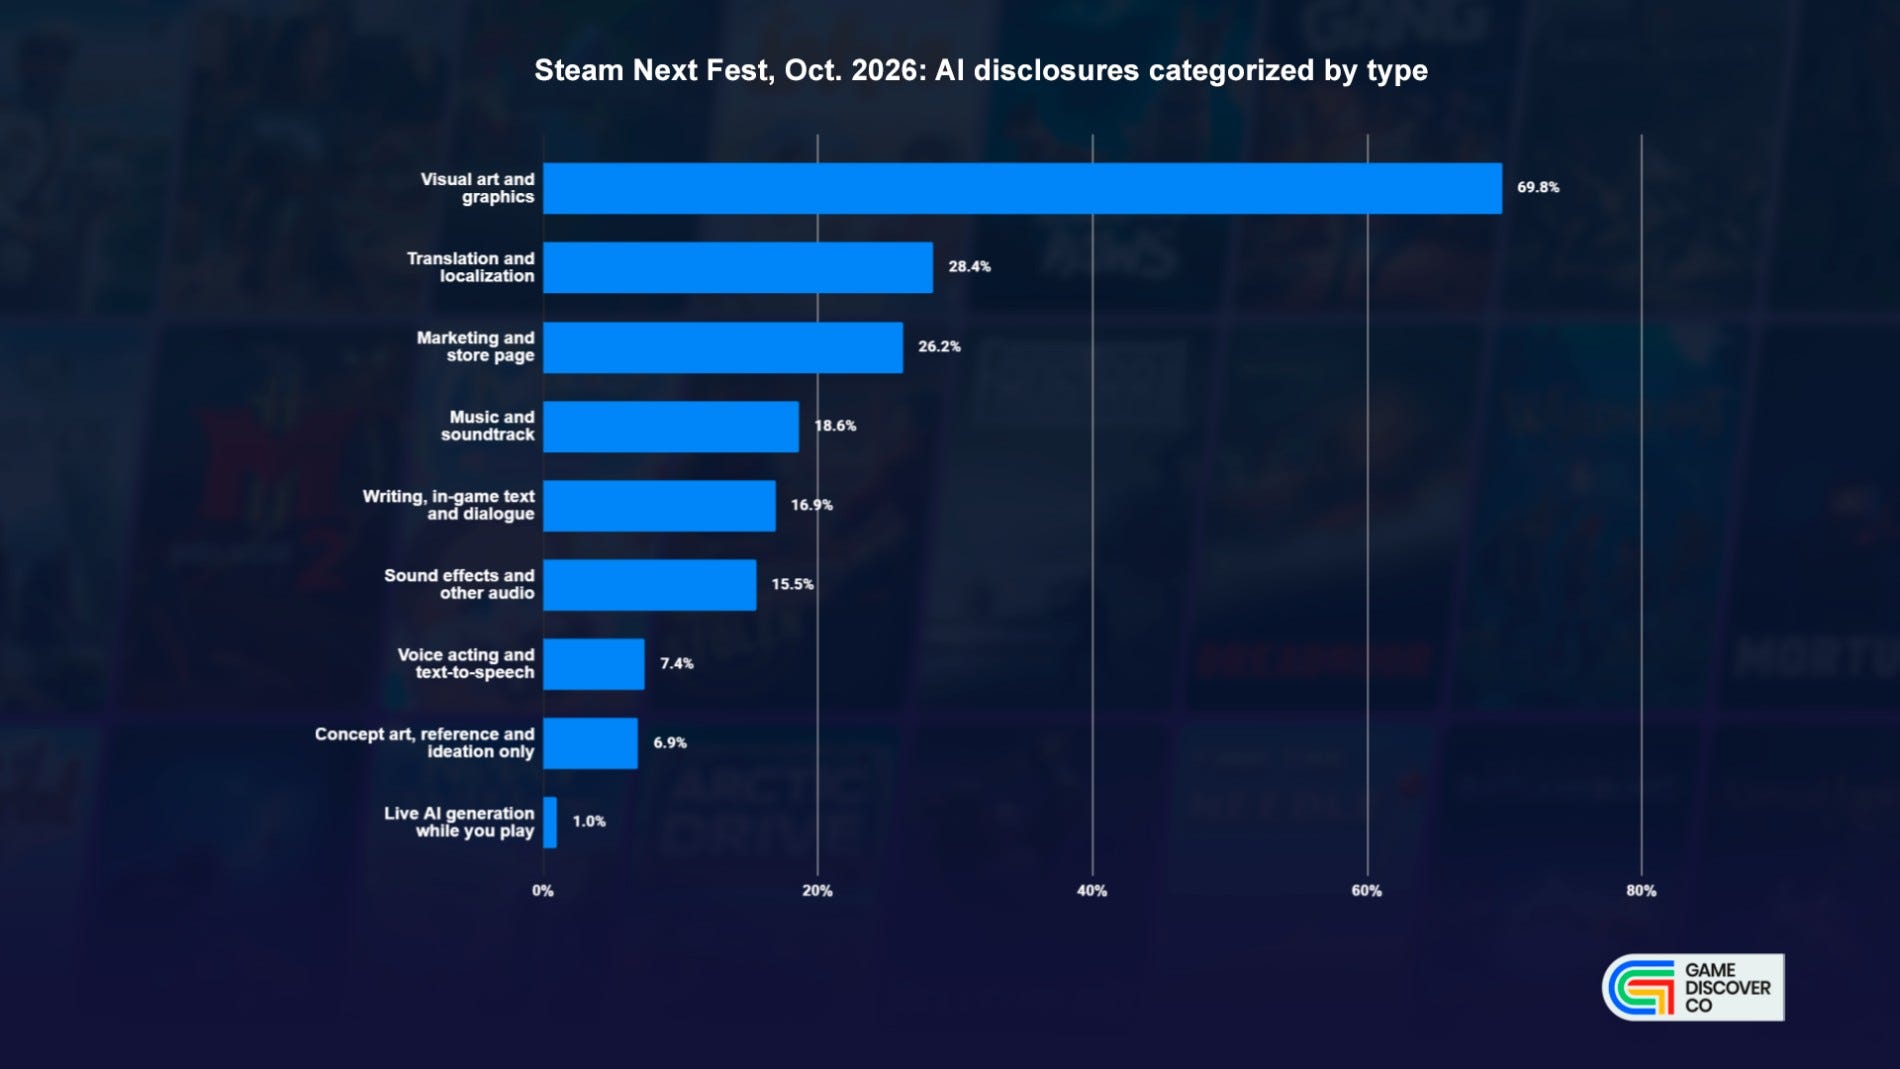
69.8% of AI disclosures relate to visuals and graphics. However, GameDiscoverCo notes that in most cases, these are in-game or store page icons rather than all of the game’s art. Next come translation and localization (28.4%), followed by marketing and the store page (26.2%).
-
Only 1% of these projects reported live AI content generation during gameplay.

-
The more popular a demo, the less often developers disclose AI use. Or, from another angle, demos without AI are more popular for now. Among games with peak CCU under 10 (including games without data), 36.4% disclosed AI; with CCU of 10-99, 25.6%; and with CCU over 100, 20.3% (52 of 256 games). Most of those 52 games use AI for secondary elements.
❗️Valve only requires disclosure of AI content. AI coding assistants don’t need to be disclosed. The data also doesn’t include games that used AI but didn’t disclose it.
-
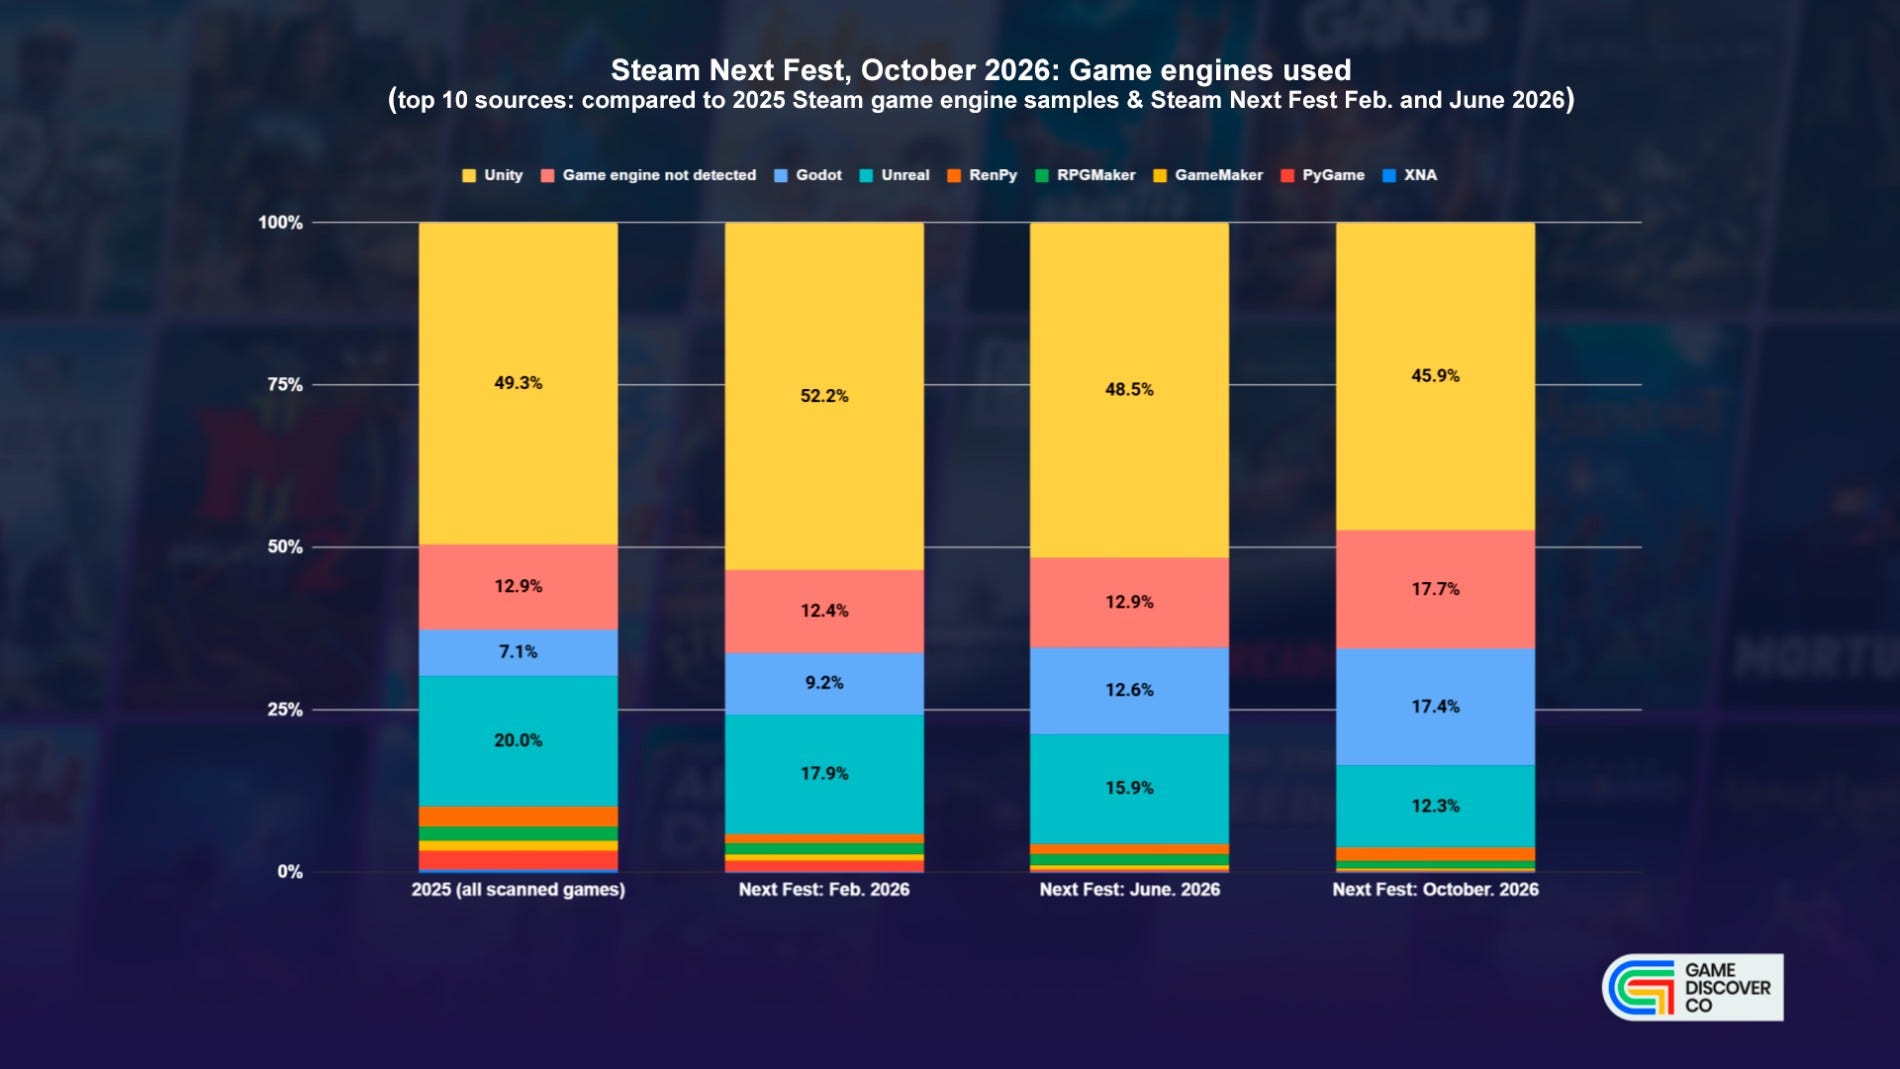
Unity is still first (45.9%), but its share is declining: it was 52.2% at the February festival. Unreal dropped to third: 12.3% vs. 17.9% in February.
-
Godot (second) grew faster than GameDiscoverCo expected: from 12.6% in June to 17.4% in October. Formally, unknown engines took second place, but I don’t think it’s right to count them, since they cover a whole family of different technical solutions.
-
The share of games whose engine couldn’t be detected jumped from 12.9% to 17.7%. In 2025 and at the two previous festivals, this figure barely changed. Members of the GameDiscoverCo Pro Discord suggest that many vibe-coded games use frameworks like Three.js, which GameDiscoverCo’s tools don’t detect. And Godot is popular with vibe coders because it’s open-source and even has an MCP interface.
-
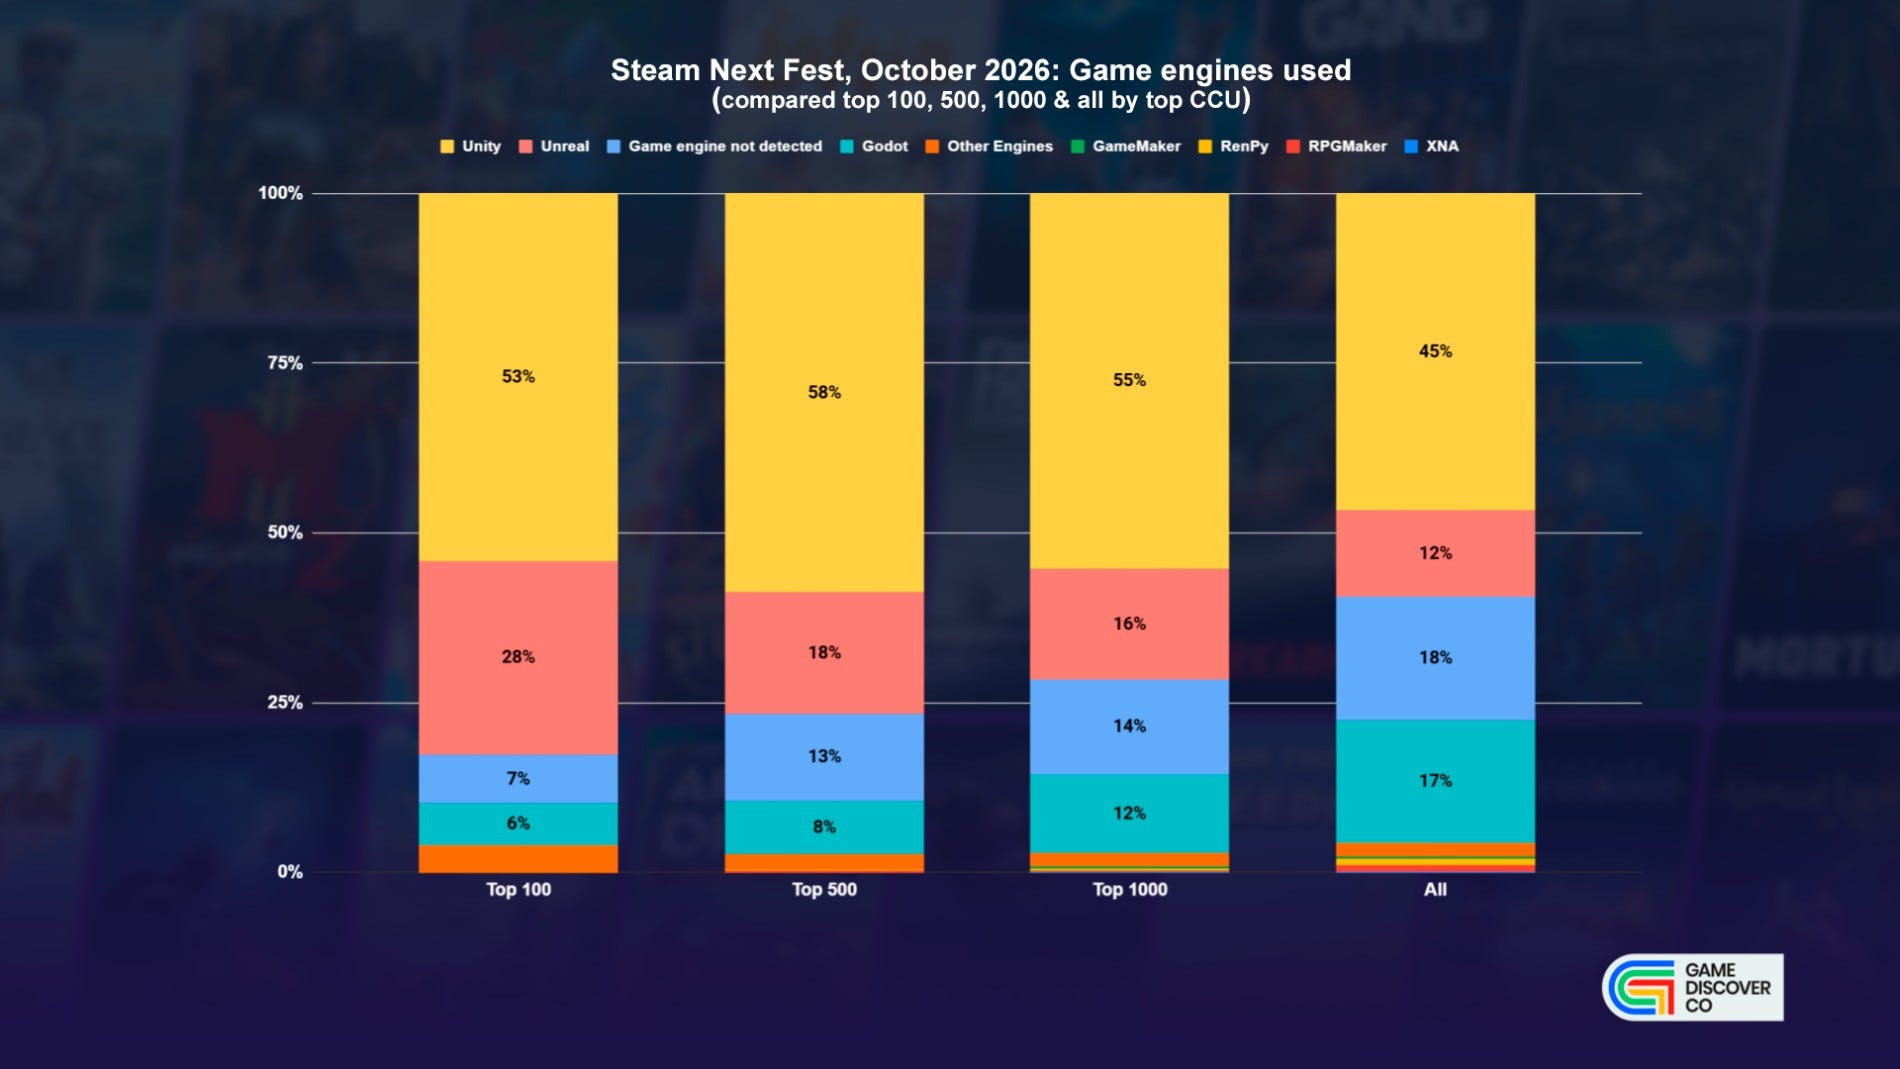
Among the festival’s top 100 games by peak CCU, Unity accounts for 53% and Unreal for 28%. Only 7% have an undetected engine, and 6% use Godot.
-
The lower a game ranks by CCU, the higher the share of Godot and unknown engines. In the top 1,000, unknown engines account for 14%, and Godot for 12%.
-
GameDiscoverCo manually reviewed games on unknown engines with a peak CCU of 1. Most are 2D bullet heaven, bullet hell, and puzzle games. Godot games cover a wider range of genres.
-
GameDiscoverCo believes AI lowers the entry barrier even further in some genres. A basic Steam Next Fest demo can probably be made almost entirely with prompts.
-
Most of these games won’t compete with other projects, and they won’t reach the top of Steam Next Fest anytime soon.
-
GameDiscoverCo sees the real threat in experienced solo developers and small teams who release good games quickly. According to GameDiscoverCo, successful projects will increasingly use AI assistants.
-
That said, GameDiscoverCo points out that even without vibe-coded games, the festival would have had over 5,000 projects.
-
Steam releases will keep rising sharply. In September 2026, 2,875 games launched on Steam (+76% YoY); in October, 3,114 had launched as of the original article’s publication on October 30 (+53% YoY).
-
If these rates hold, around 35,000 games will launch on Steam in 2027. In 2025, 21,000 games launched; in 2026, 23,000 as of the end of October. For comparison, Chris Zukowski forecasts 29,300 Steam releases for full-year 2026.
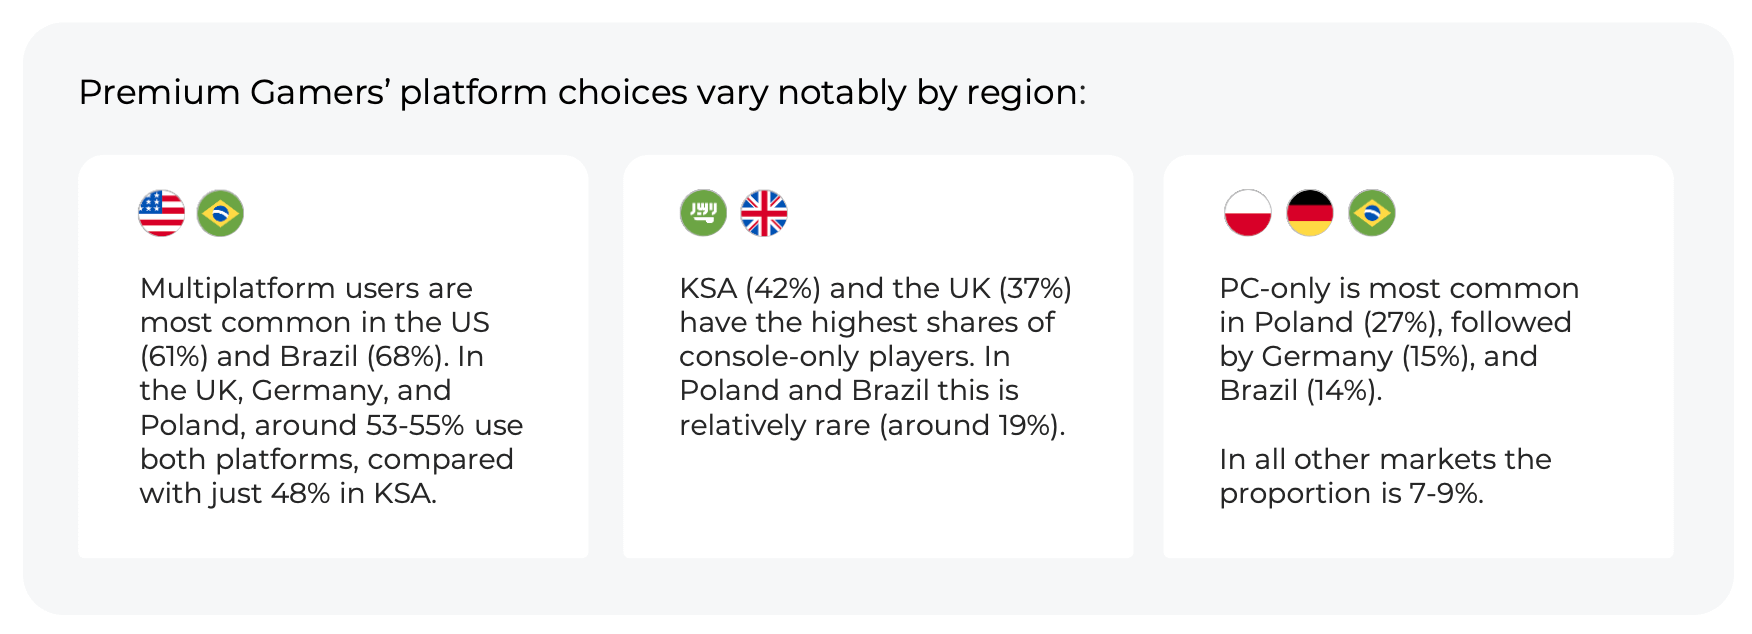
The data comes from an online Newzoo survey conducted in August 2026. Newzoo surveyed 6,166 players aged 18-55 in the US, the UK, Germany, Poland, Brazil, and Saudi Arabia. Only players who play on PC or current-generation consoles at least once a month, and who bought a AAA/AA game or played one through a subscription in the past year, were included.
-
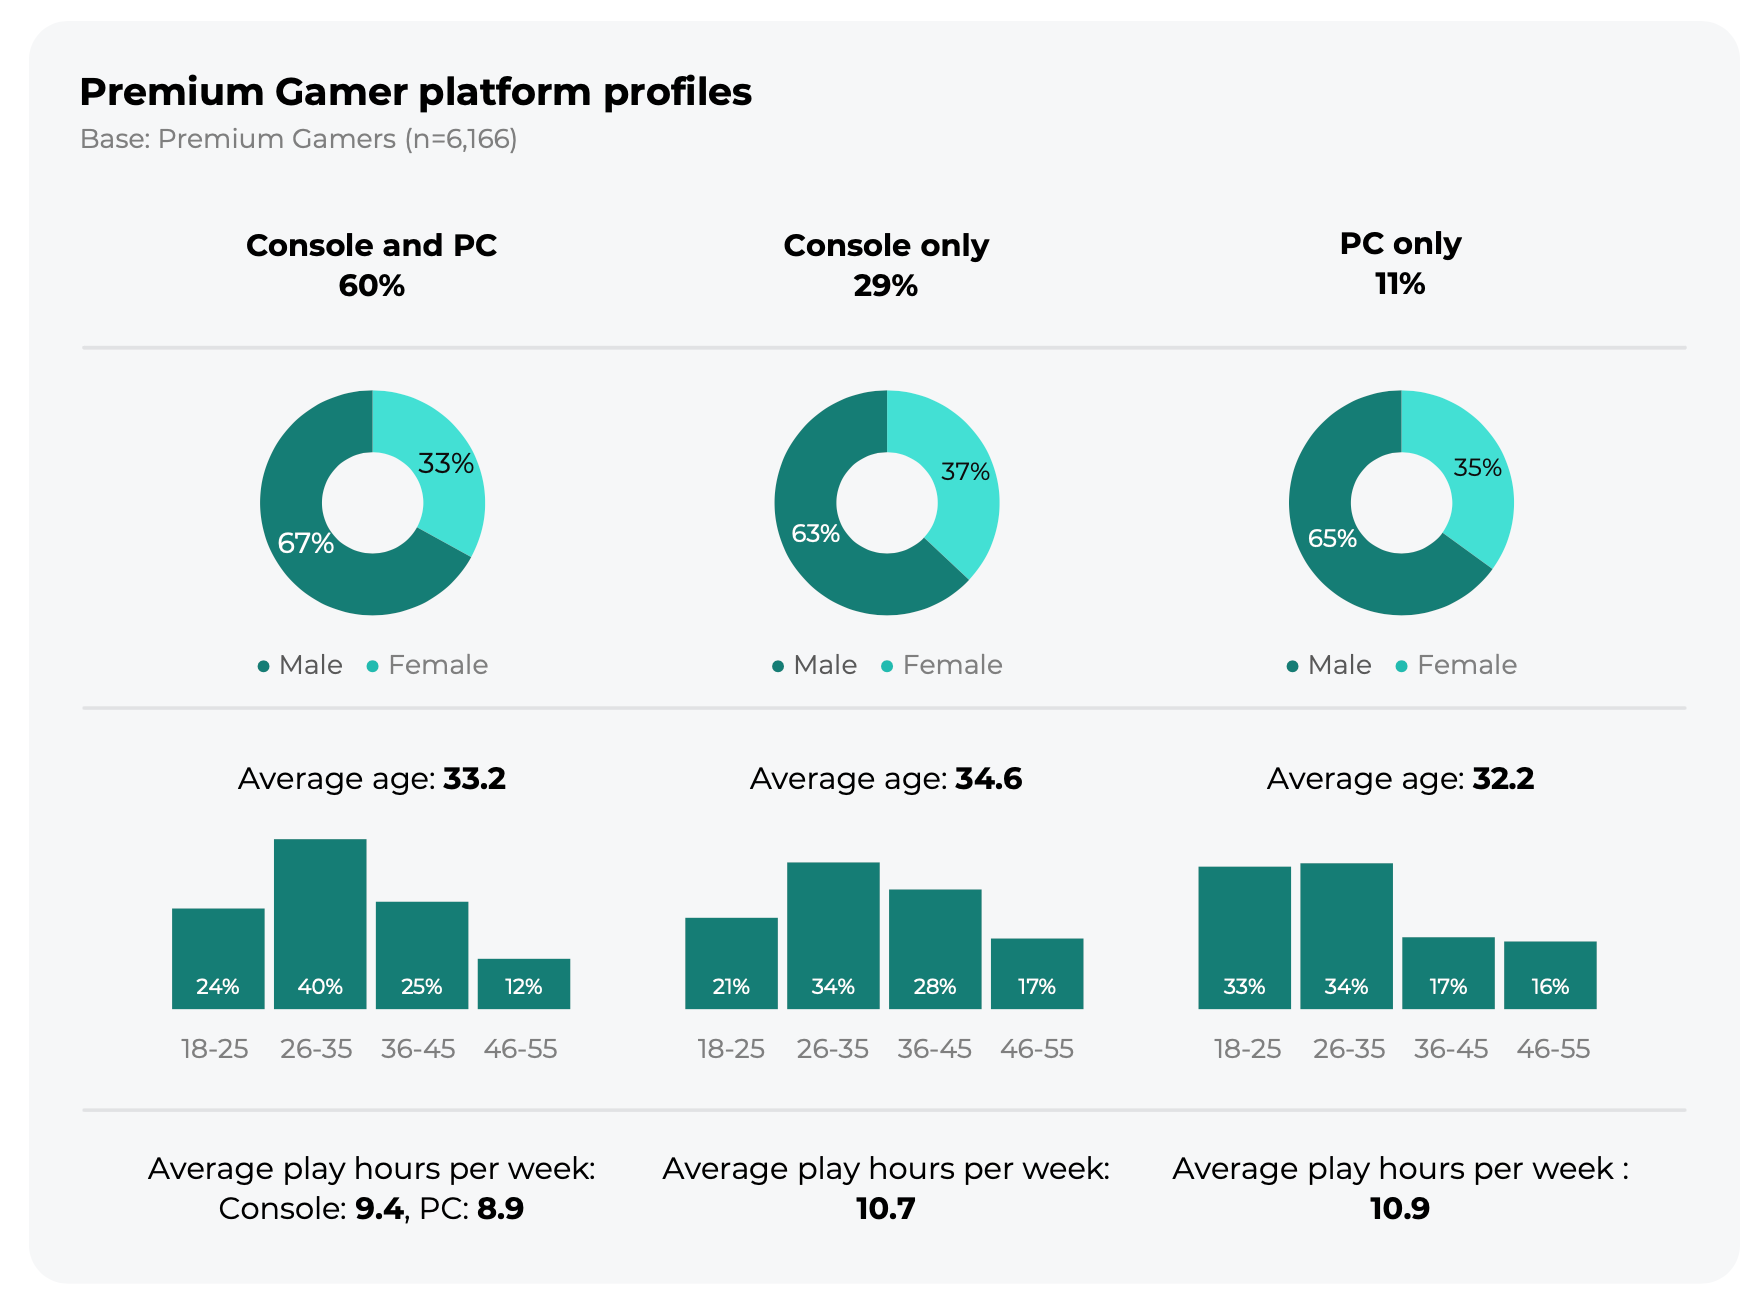
60% of respondents play on both console and PC, 29% on console only, and 11% on PC only. About two-thirds of players are male, and the average age is around 33.
A word from our sponsor

You found the right contractor, and they said yes. Now there’s a contract to draft, an NDA to sign, and a cross-border payment to set up. Mellow handles all of it in one flow — contracts with IP and NDA clauses, compliant payments, and every document in one place.
-
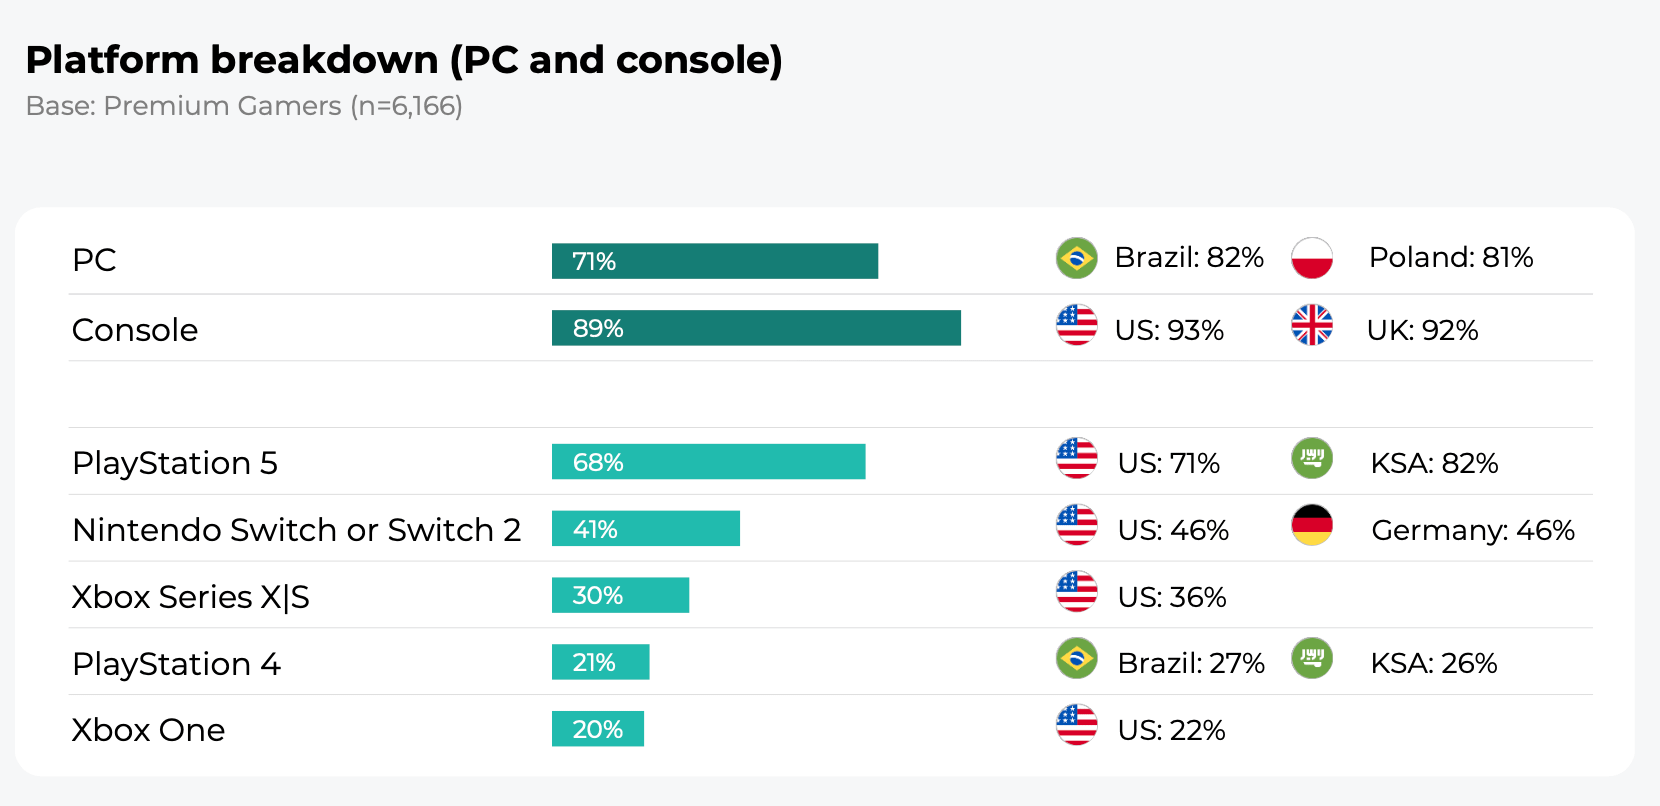
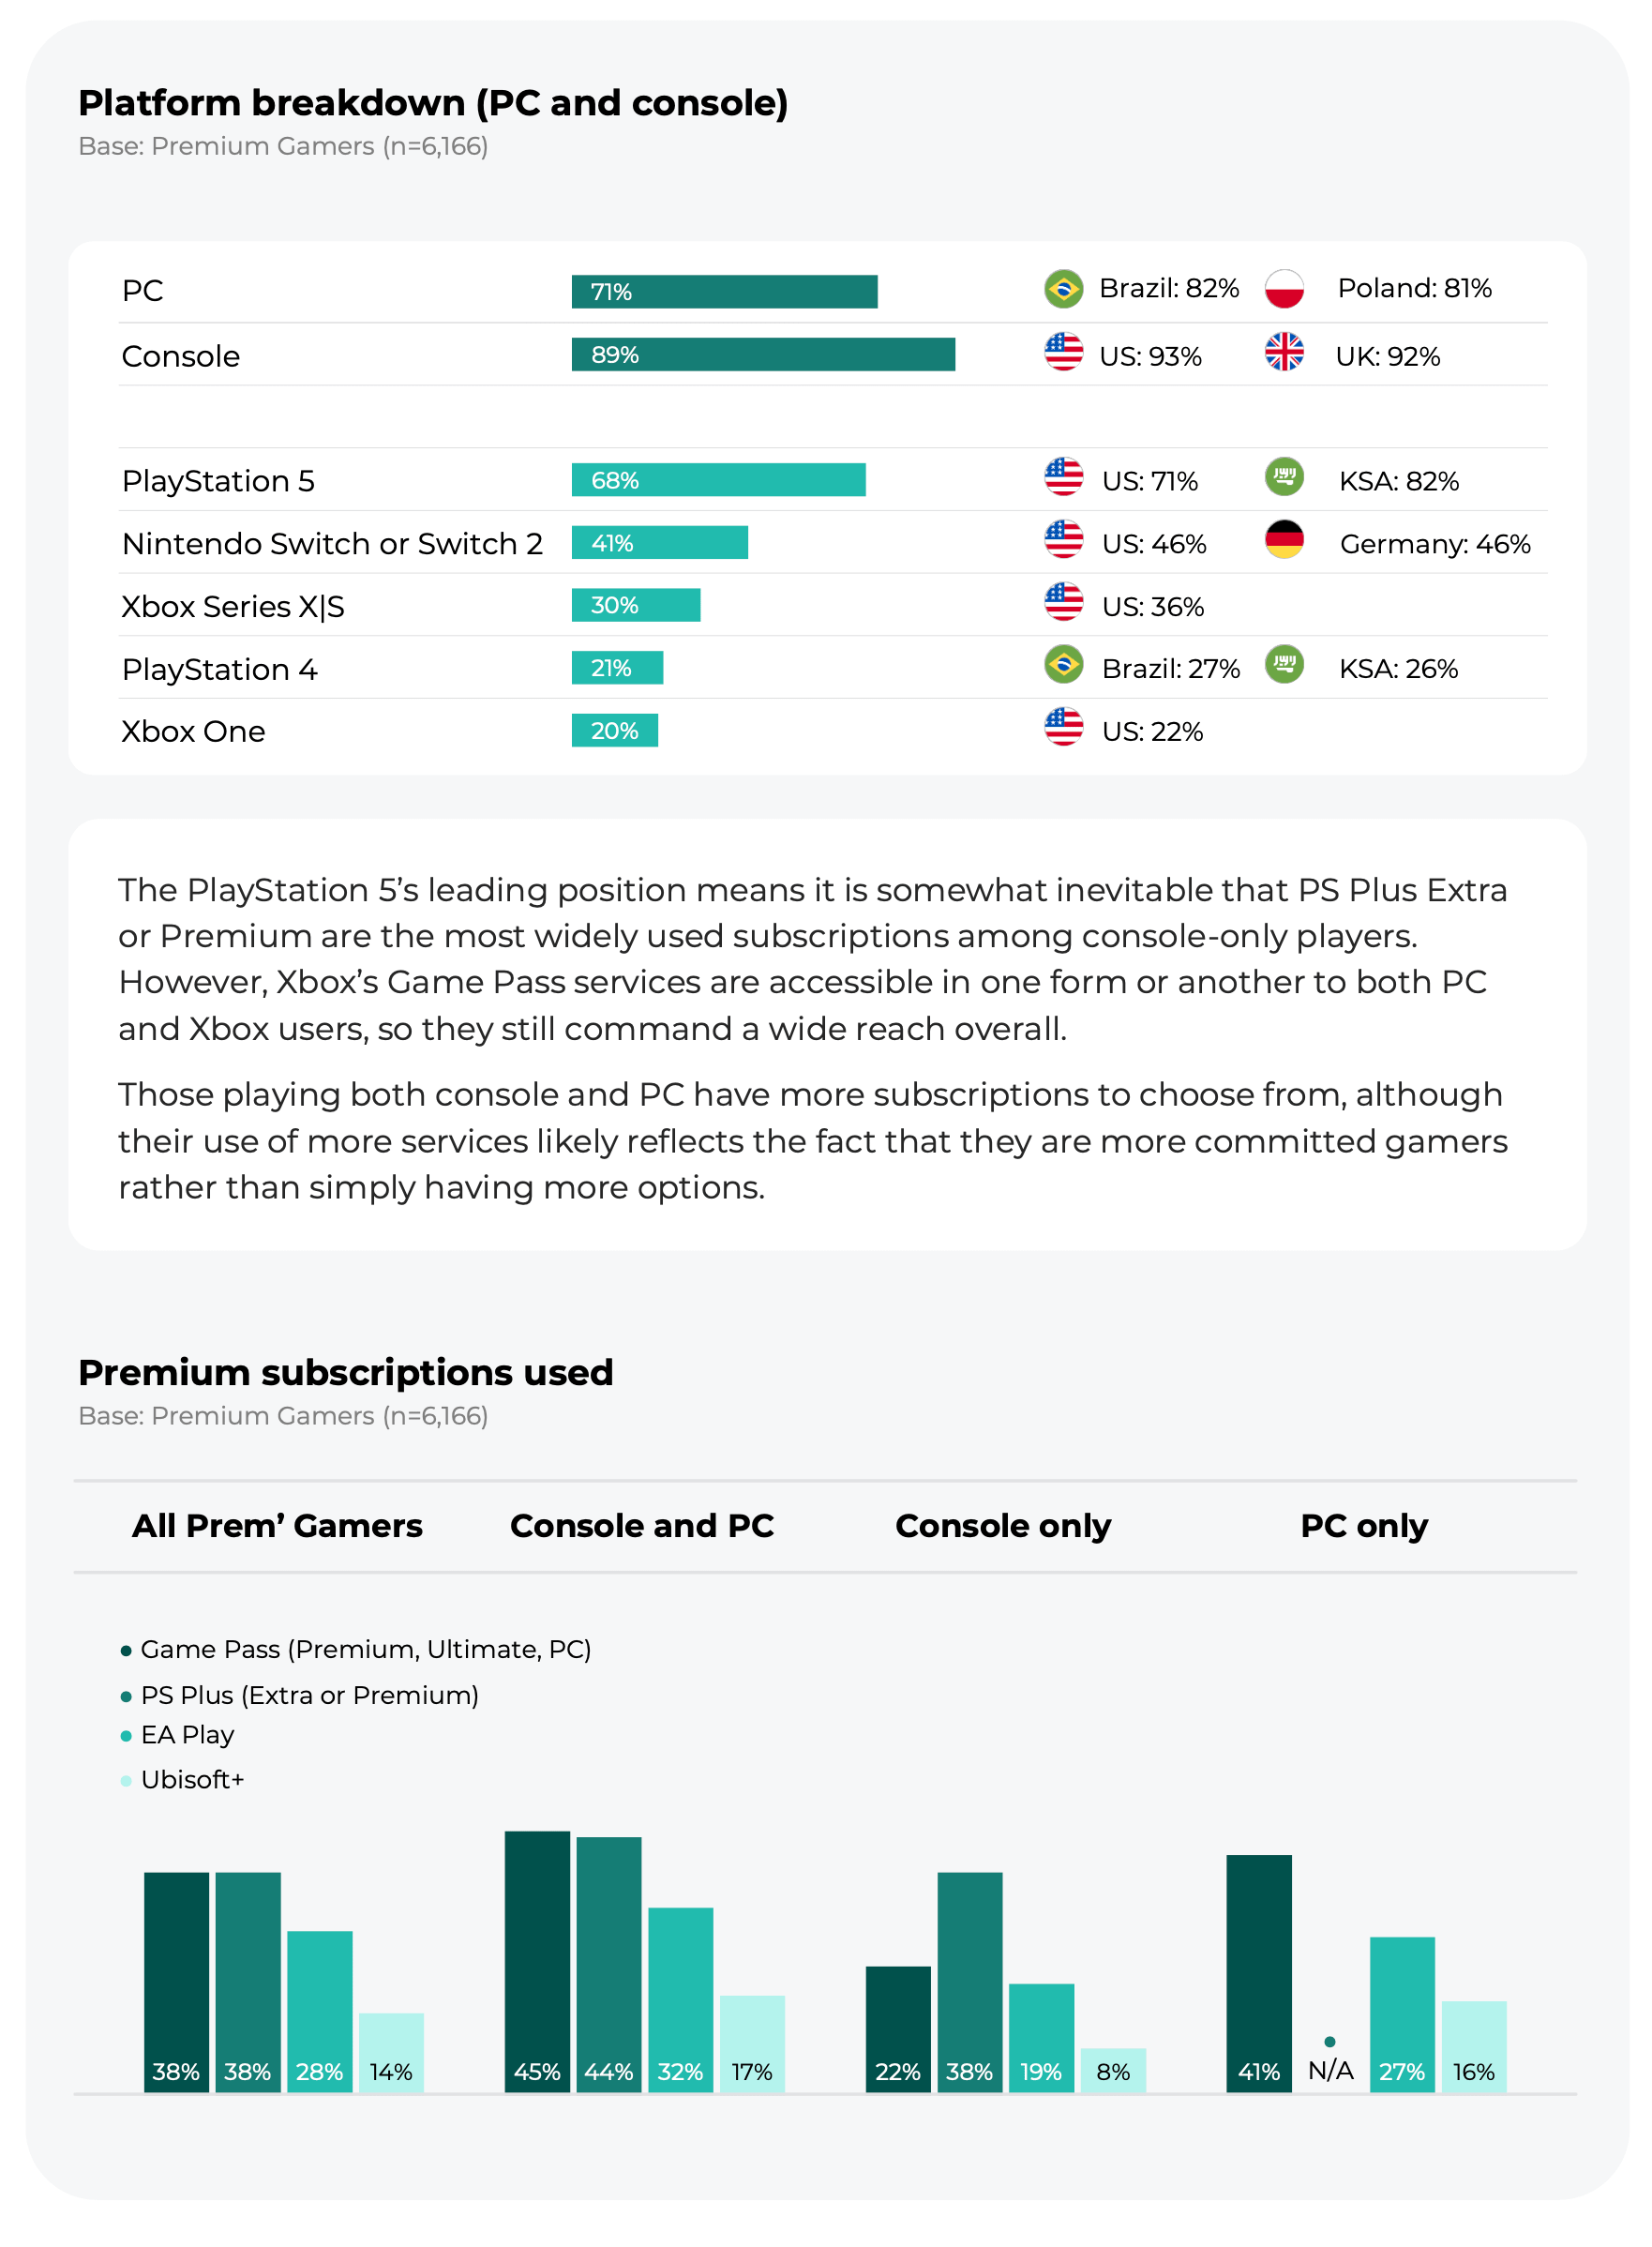
89% of respondents play on console, and 71% on PC. PlayStation 5 is the most popular console (68%), followed by Nintendo Switch or Switch 2 (41%), and Xbox Series X|S (30%).
-
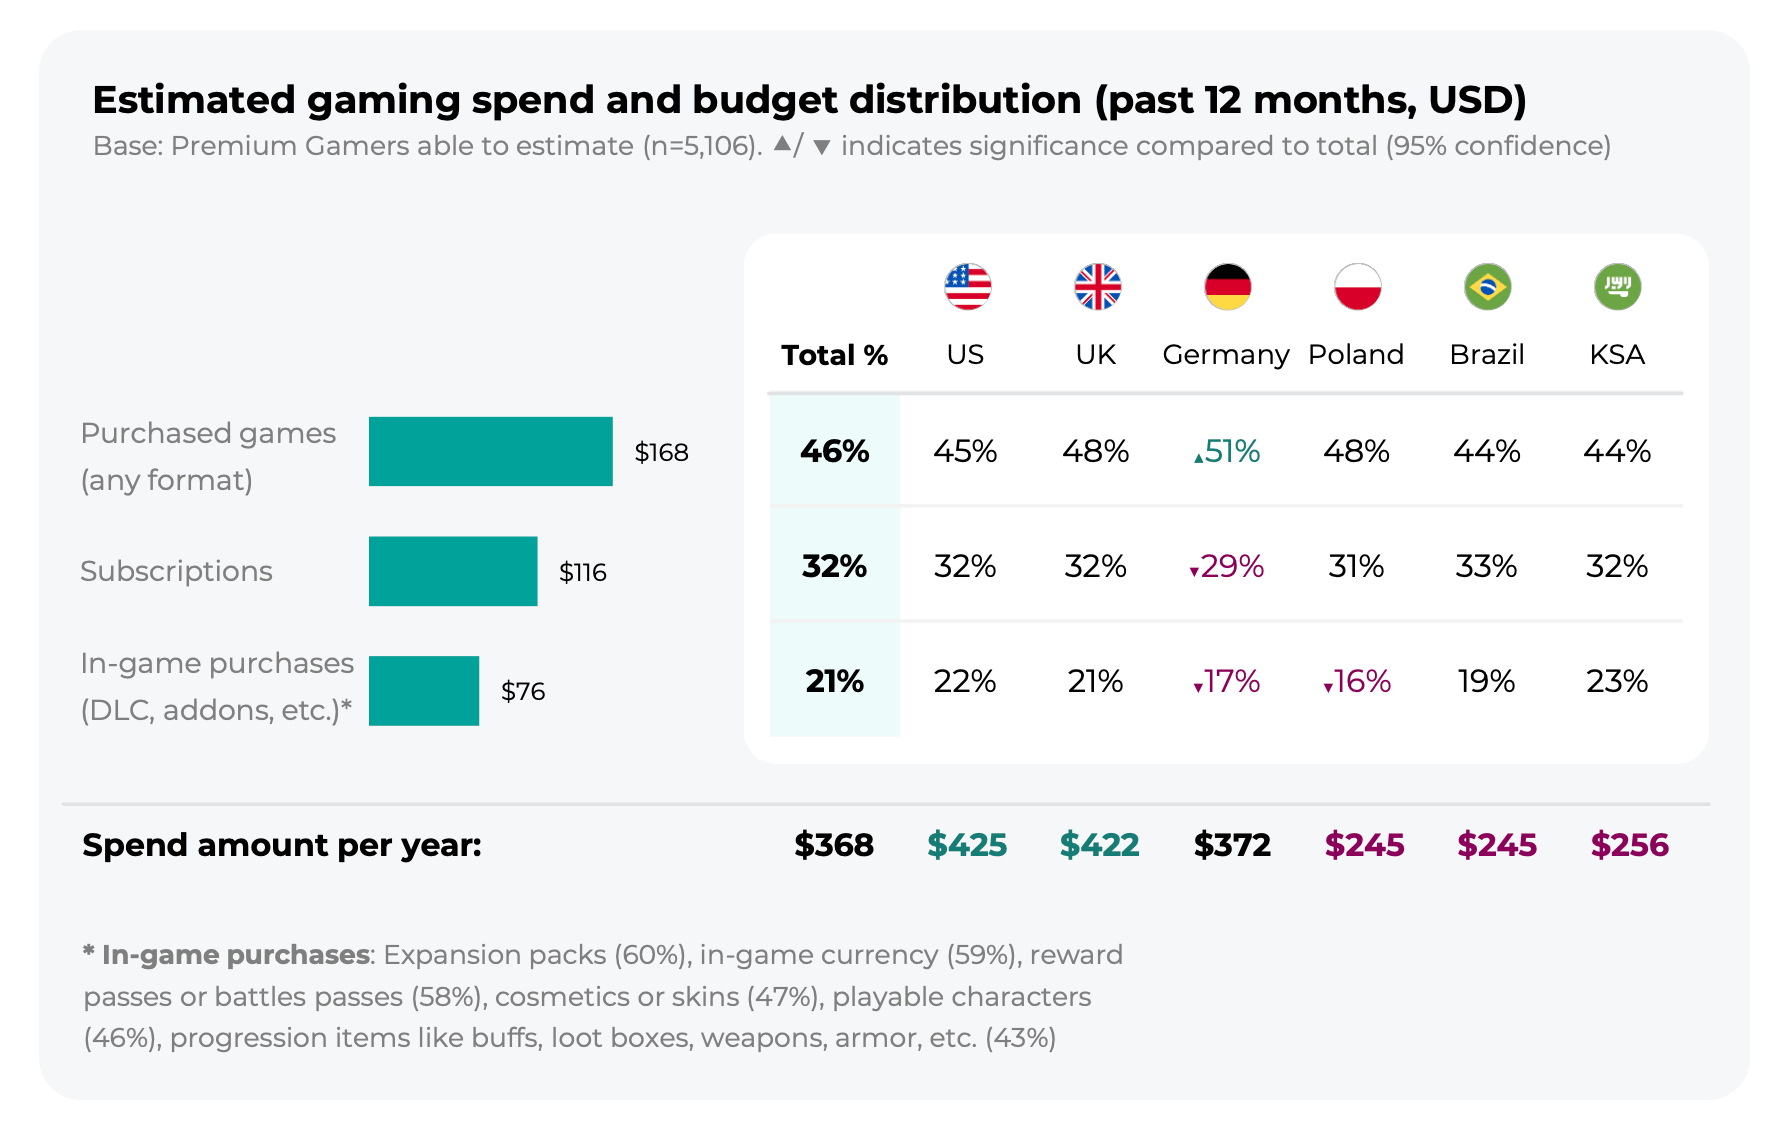
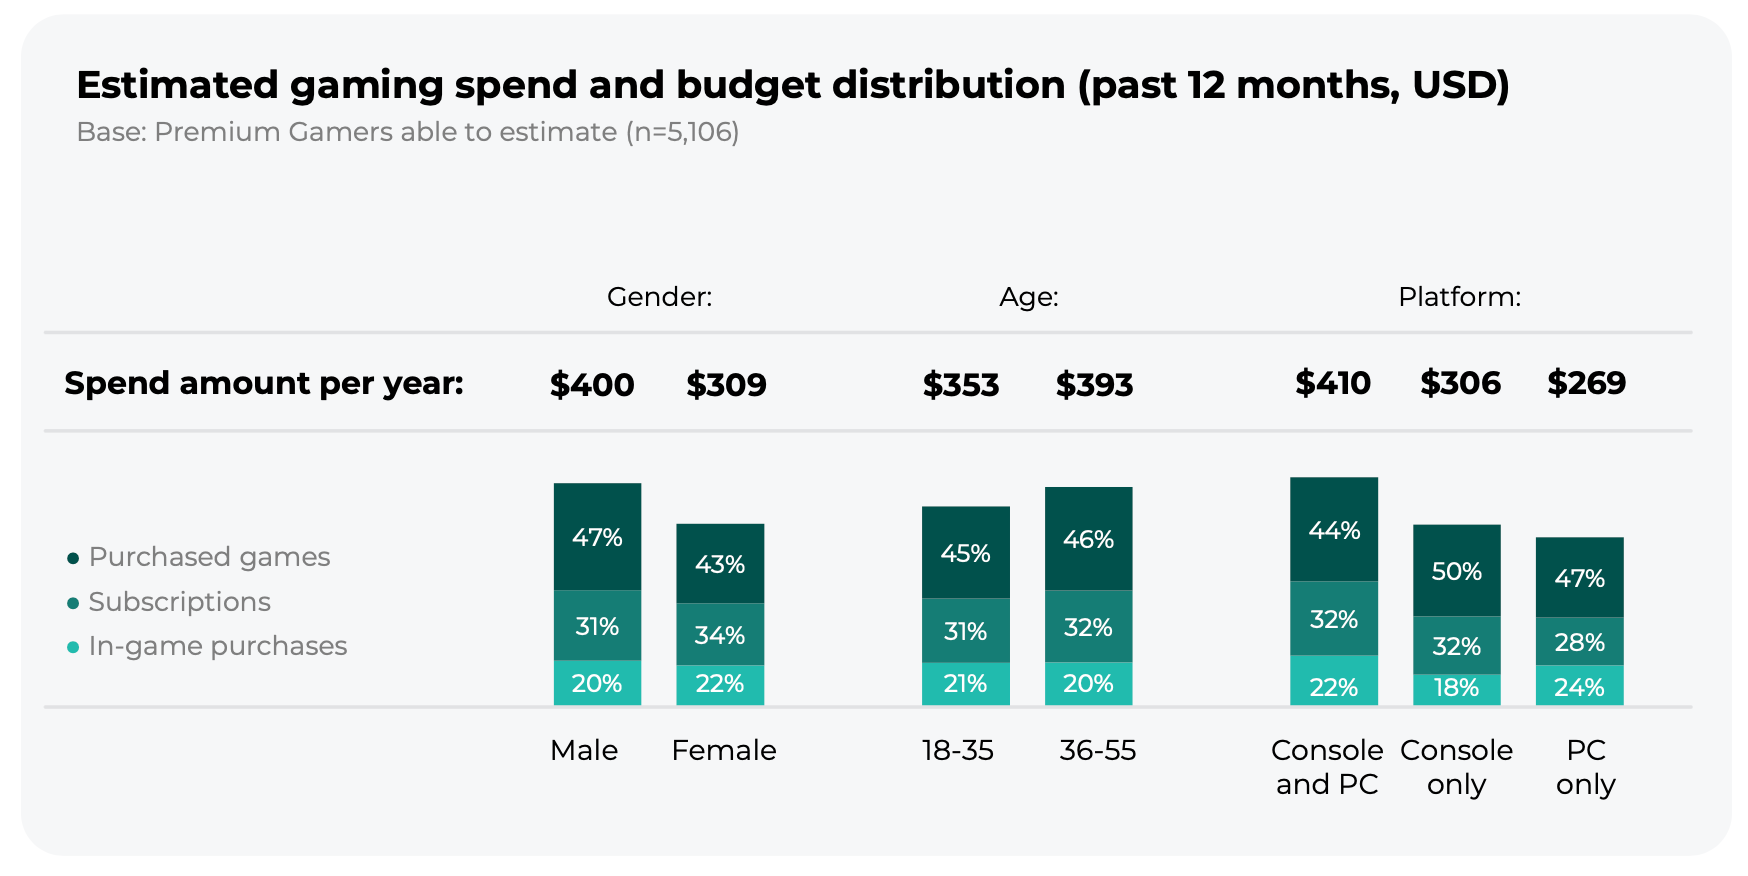
On average, a player in the sample spends $368 a year on games. Of that, 46% goes to buying games, 32% to subscriptions, and 21% to in-game purchases (add-ons, currency, battle passes, etc.).
-
Players in the US ($425 a year) and the UK ($422 a year) spend the most. In Poland and Brazil, it’s $245 a year each; in Saudi Arabia, it’s $256 a year. In Germany, players spend more on buying games (51%). Germans and Polish gamers spend less on in-game purchases than others (17% and 16%).
-
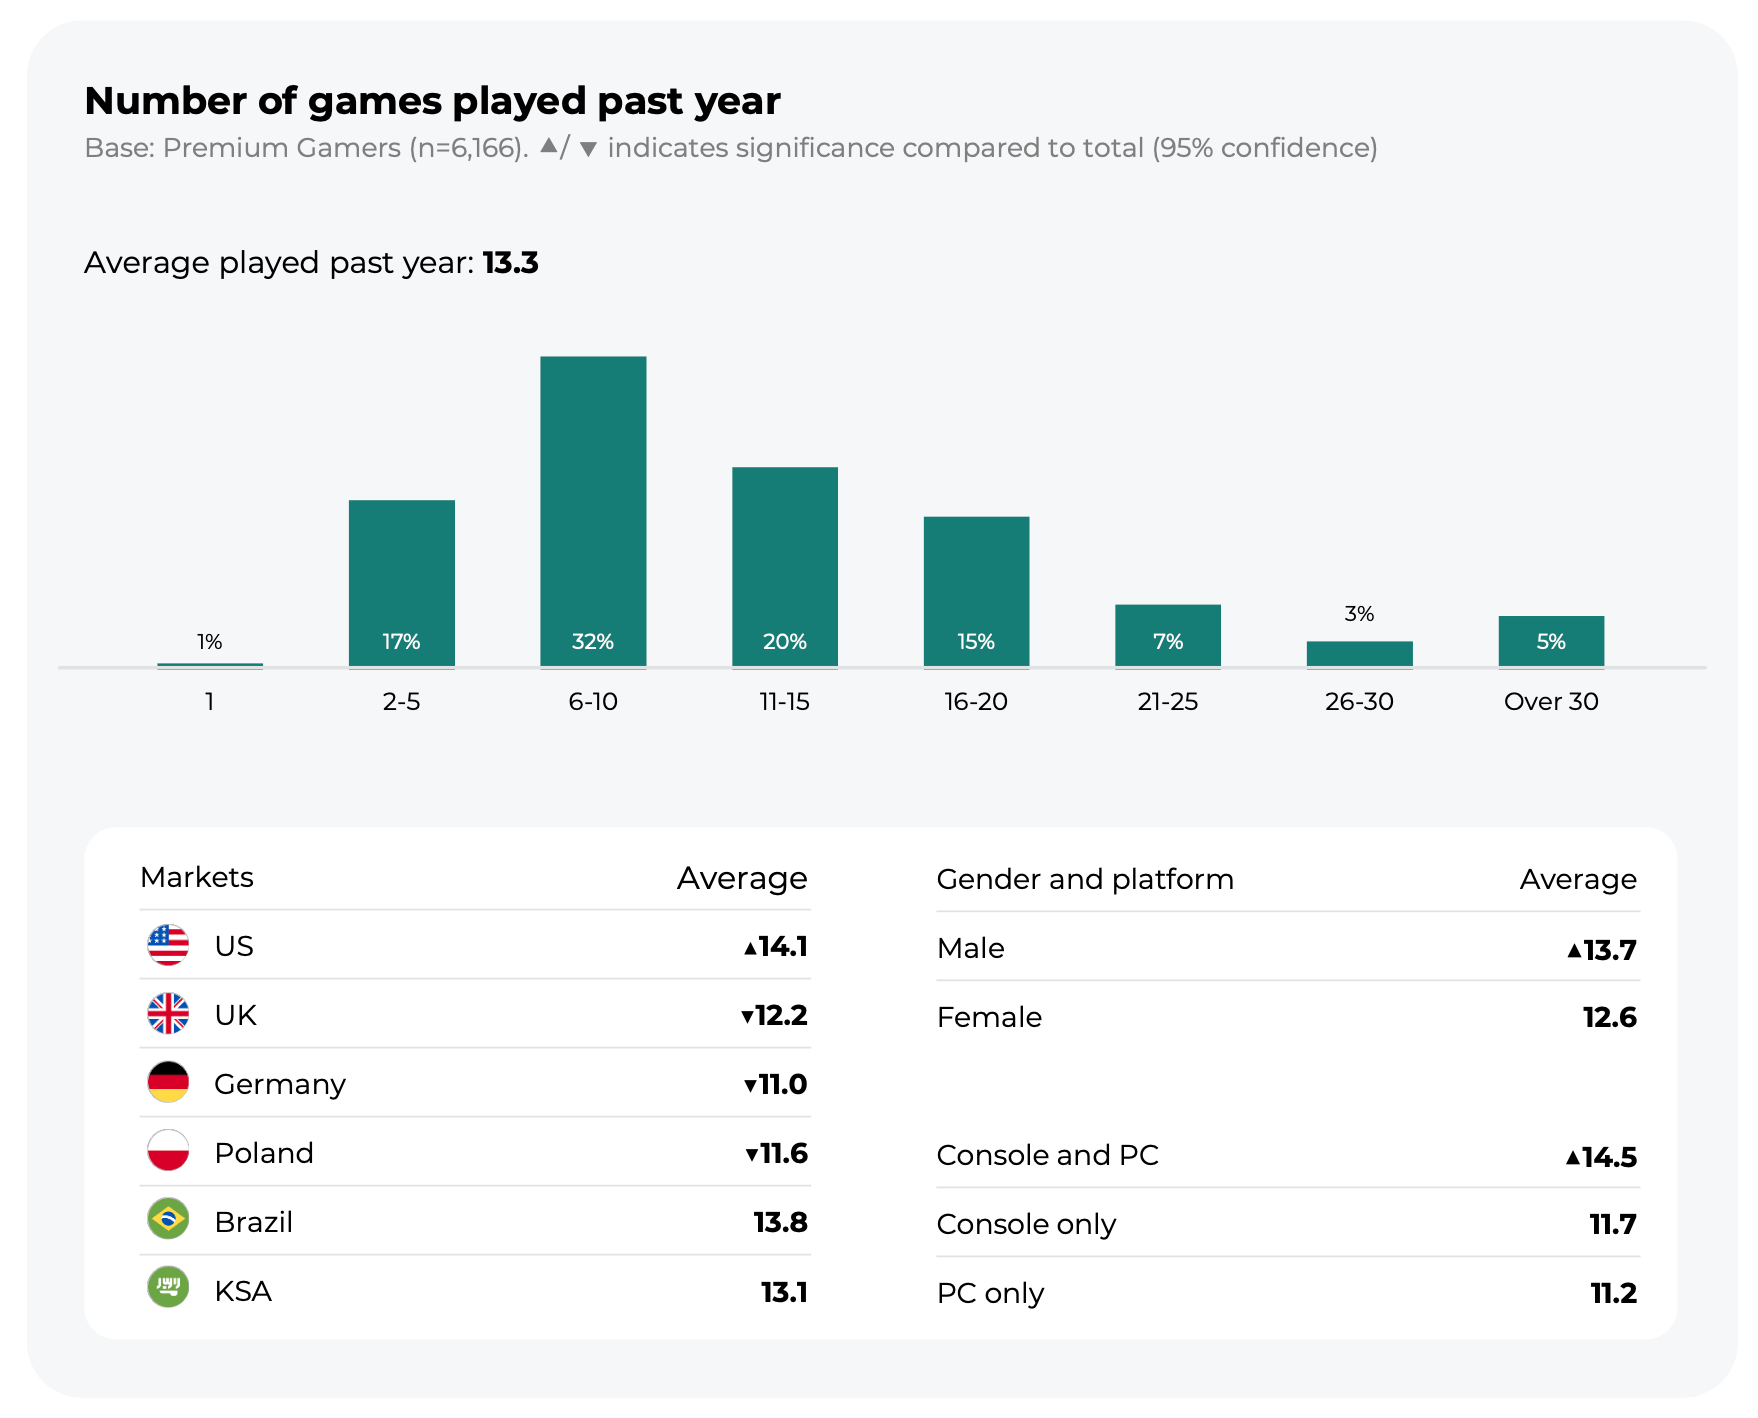
Over the past year, respondents played 13.3 games on average. The US had the most (14.1), and Germany the fewest (11.0).
-
When asked what they played, players mostly named long-running franchises like Call of Duty, GTA, Fortnite, and Minecraft. Newzoo points out that back in 2023, 61% of all PC and console playtime went to games more than six years old.
-
According to more recent Newzoo data, 64% of PC playtime in 2025 went to games released before 2019.
-
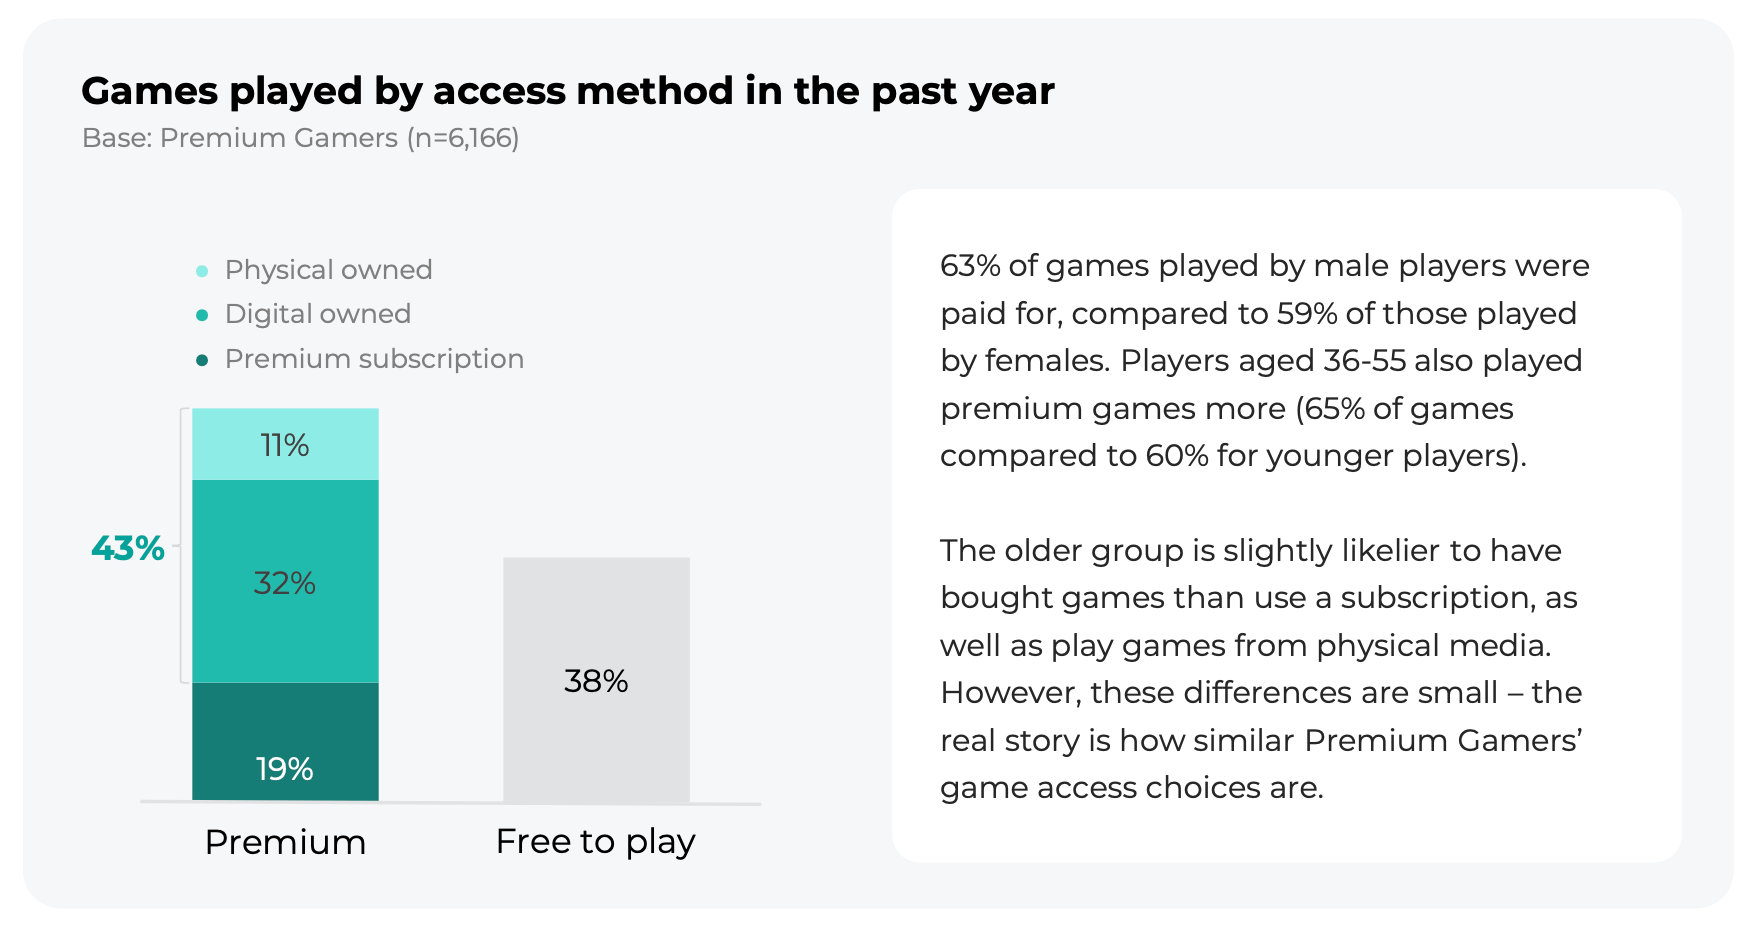
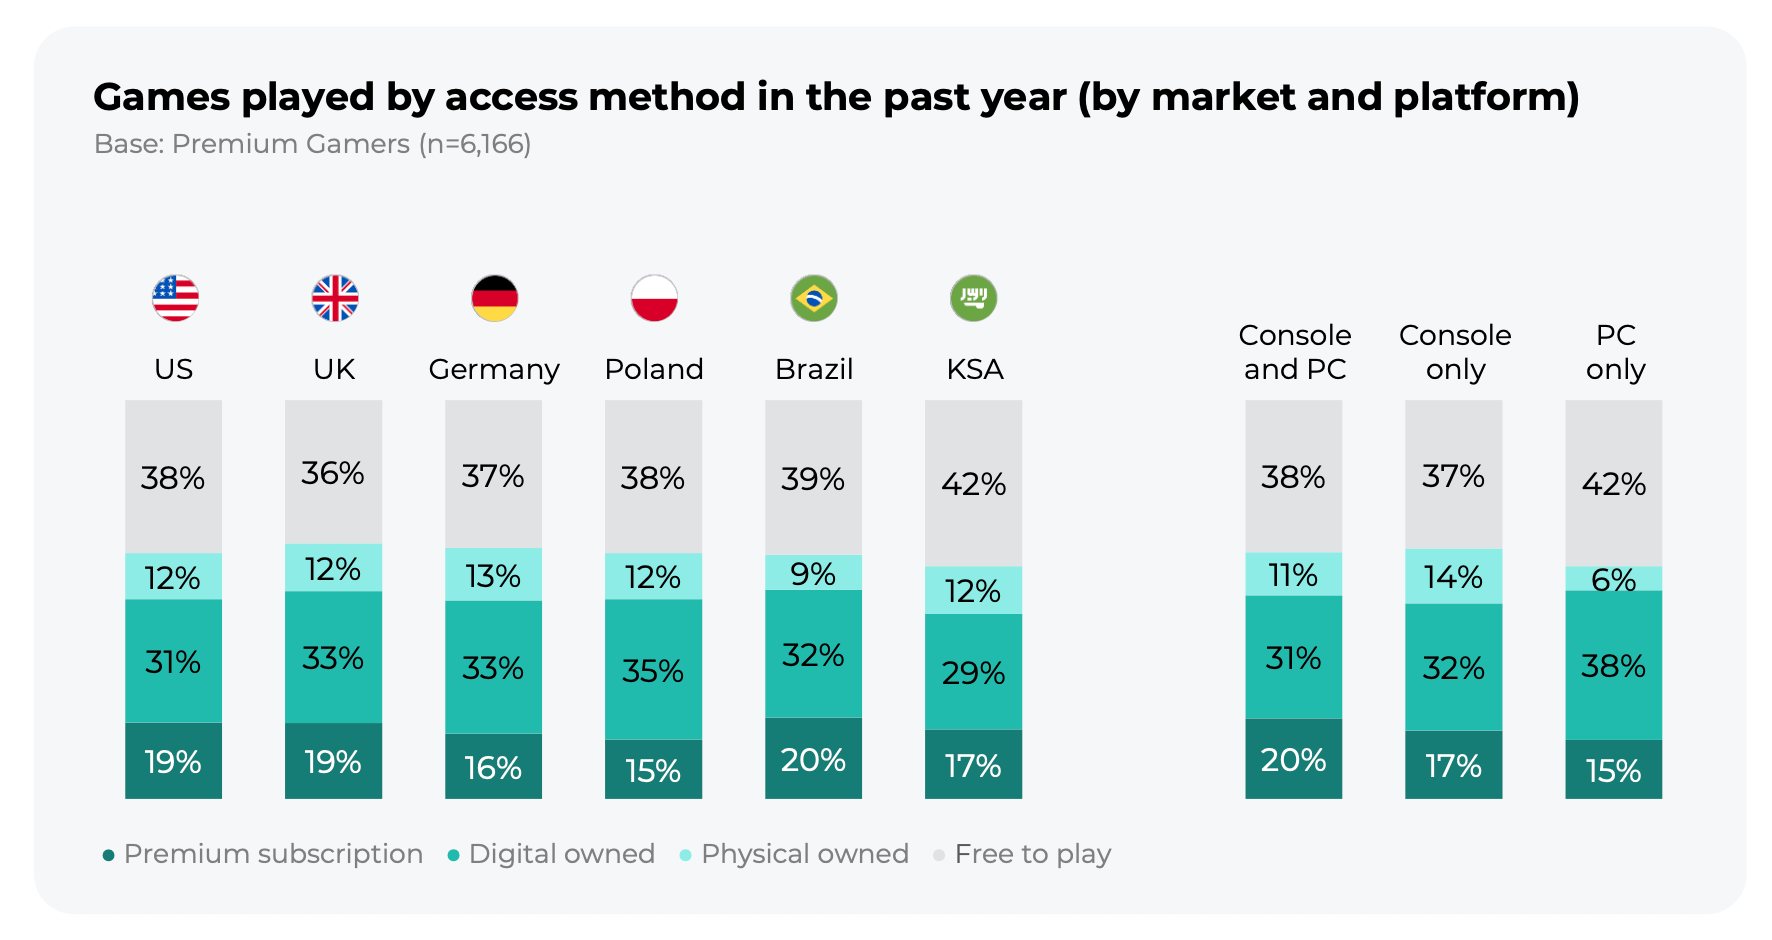
38% of the games respondents played over the past year were F2P. 43% were B2P (32% bought digitally, 11% on physical disks), and another 19% were accessed through a subscription.
-
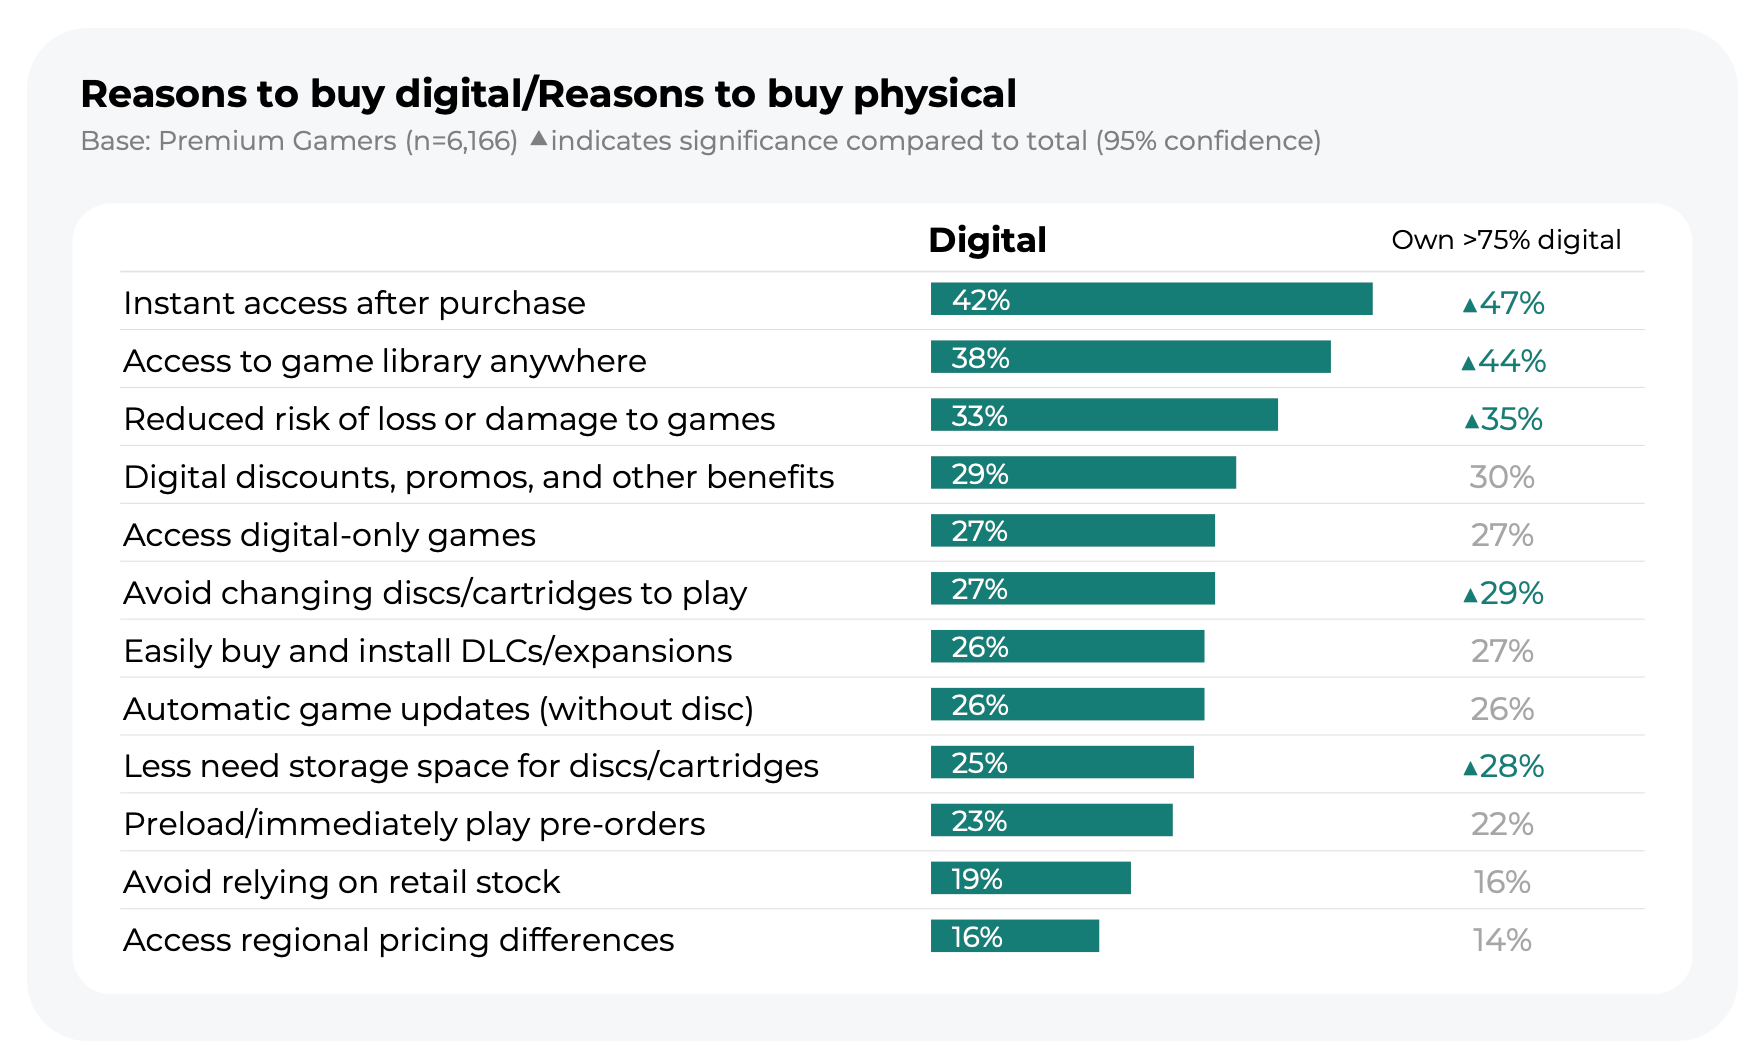
Players buy digital copies for instant access after purchase (42%), access to their library from anywhere (38%), and because they can’t be lost or damaged (33%).
-
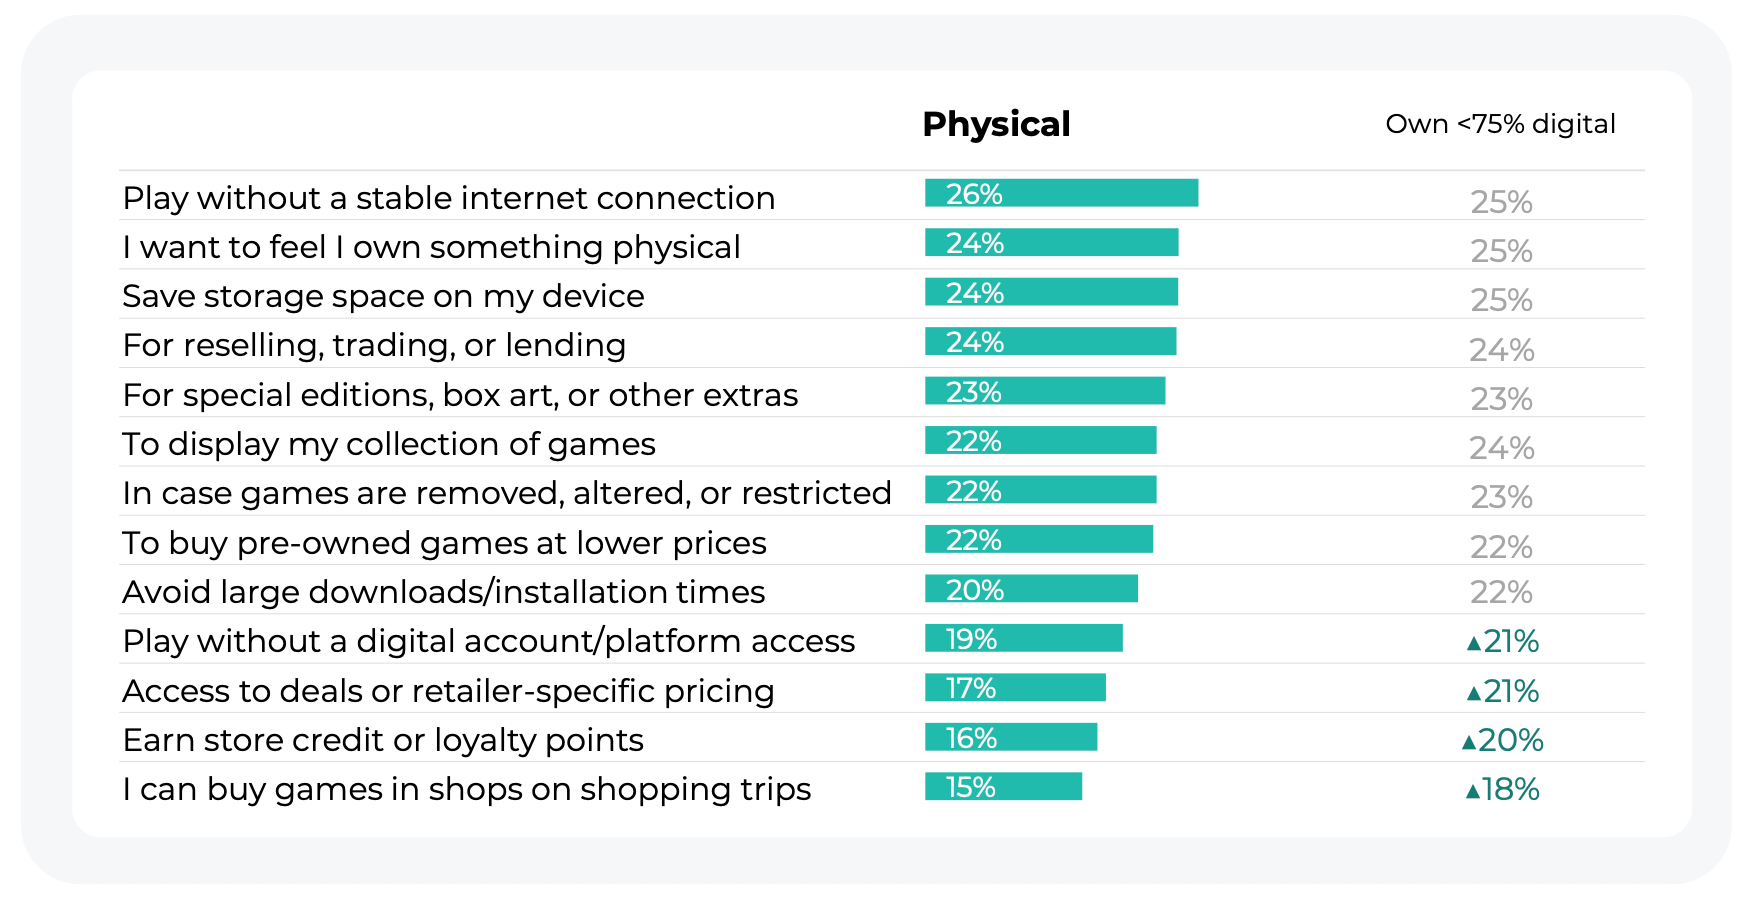
Reasons for buying physical copies include playing without a stable internet connection (26%), wanting to own something physical (24%), and saving storage space on the device (24%).
❗️The storage space point is questionable, of course. On PlayStation (my main gaming device), even a disc game gets installed on the internal drive.
-
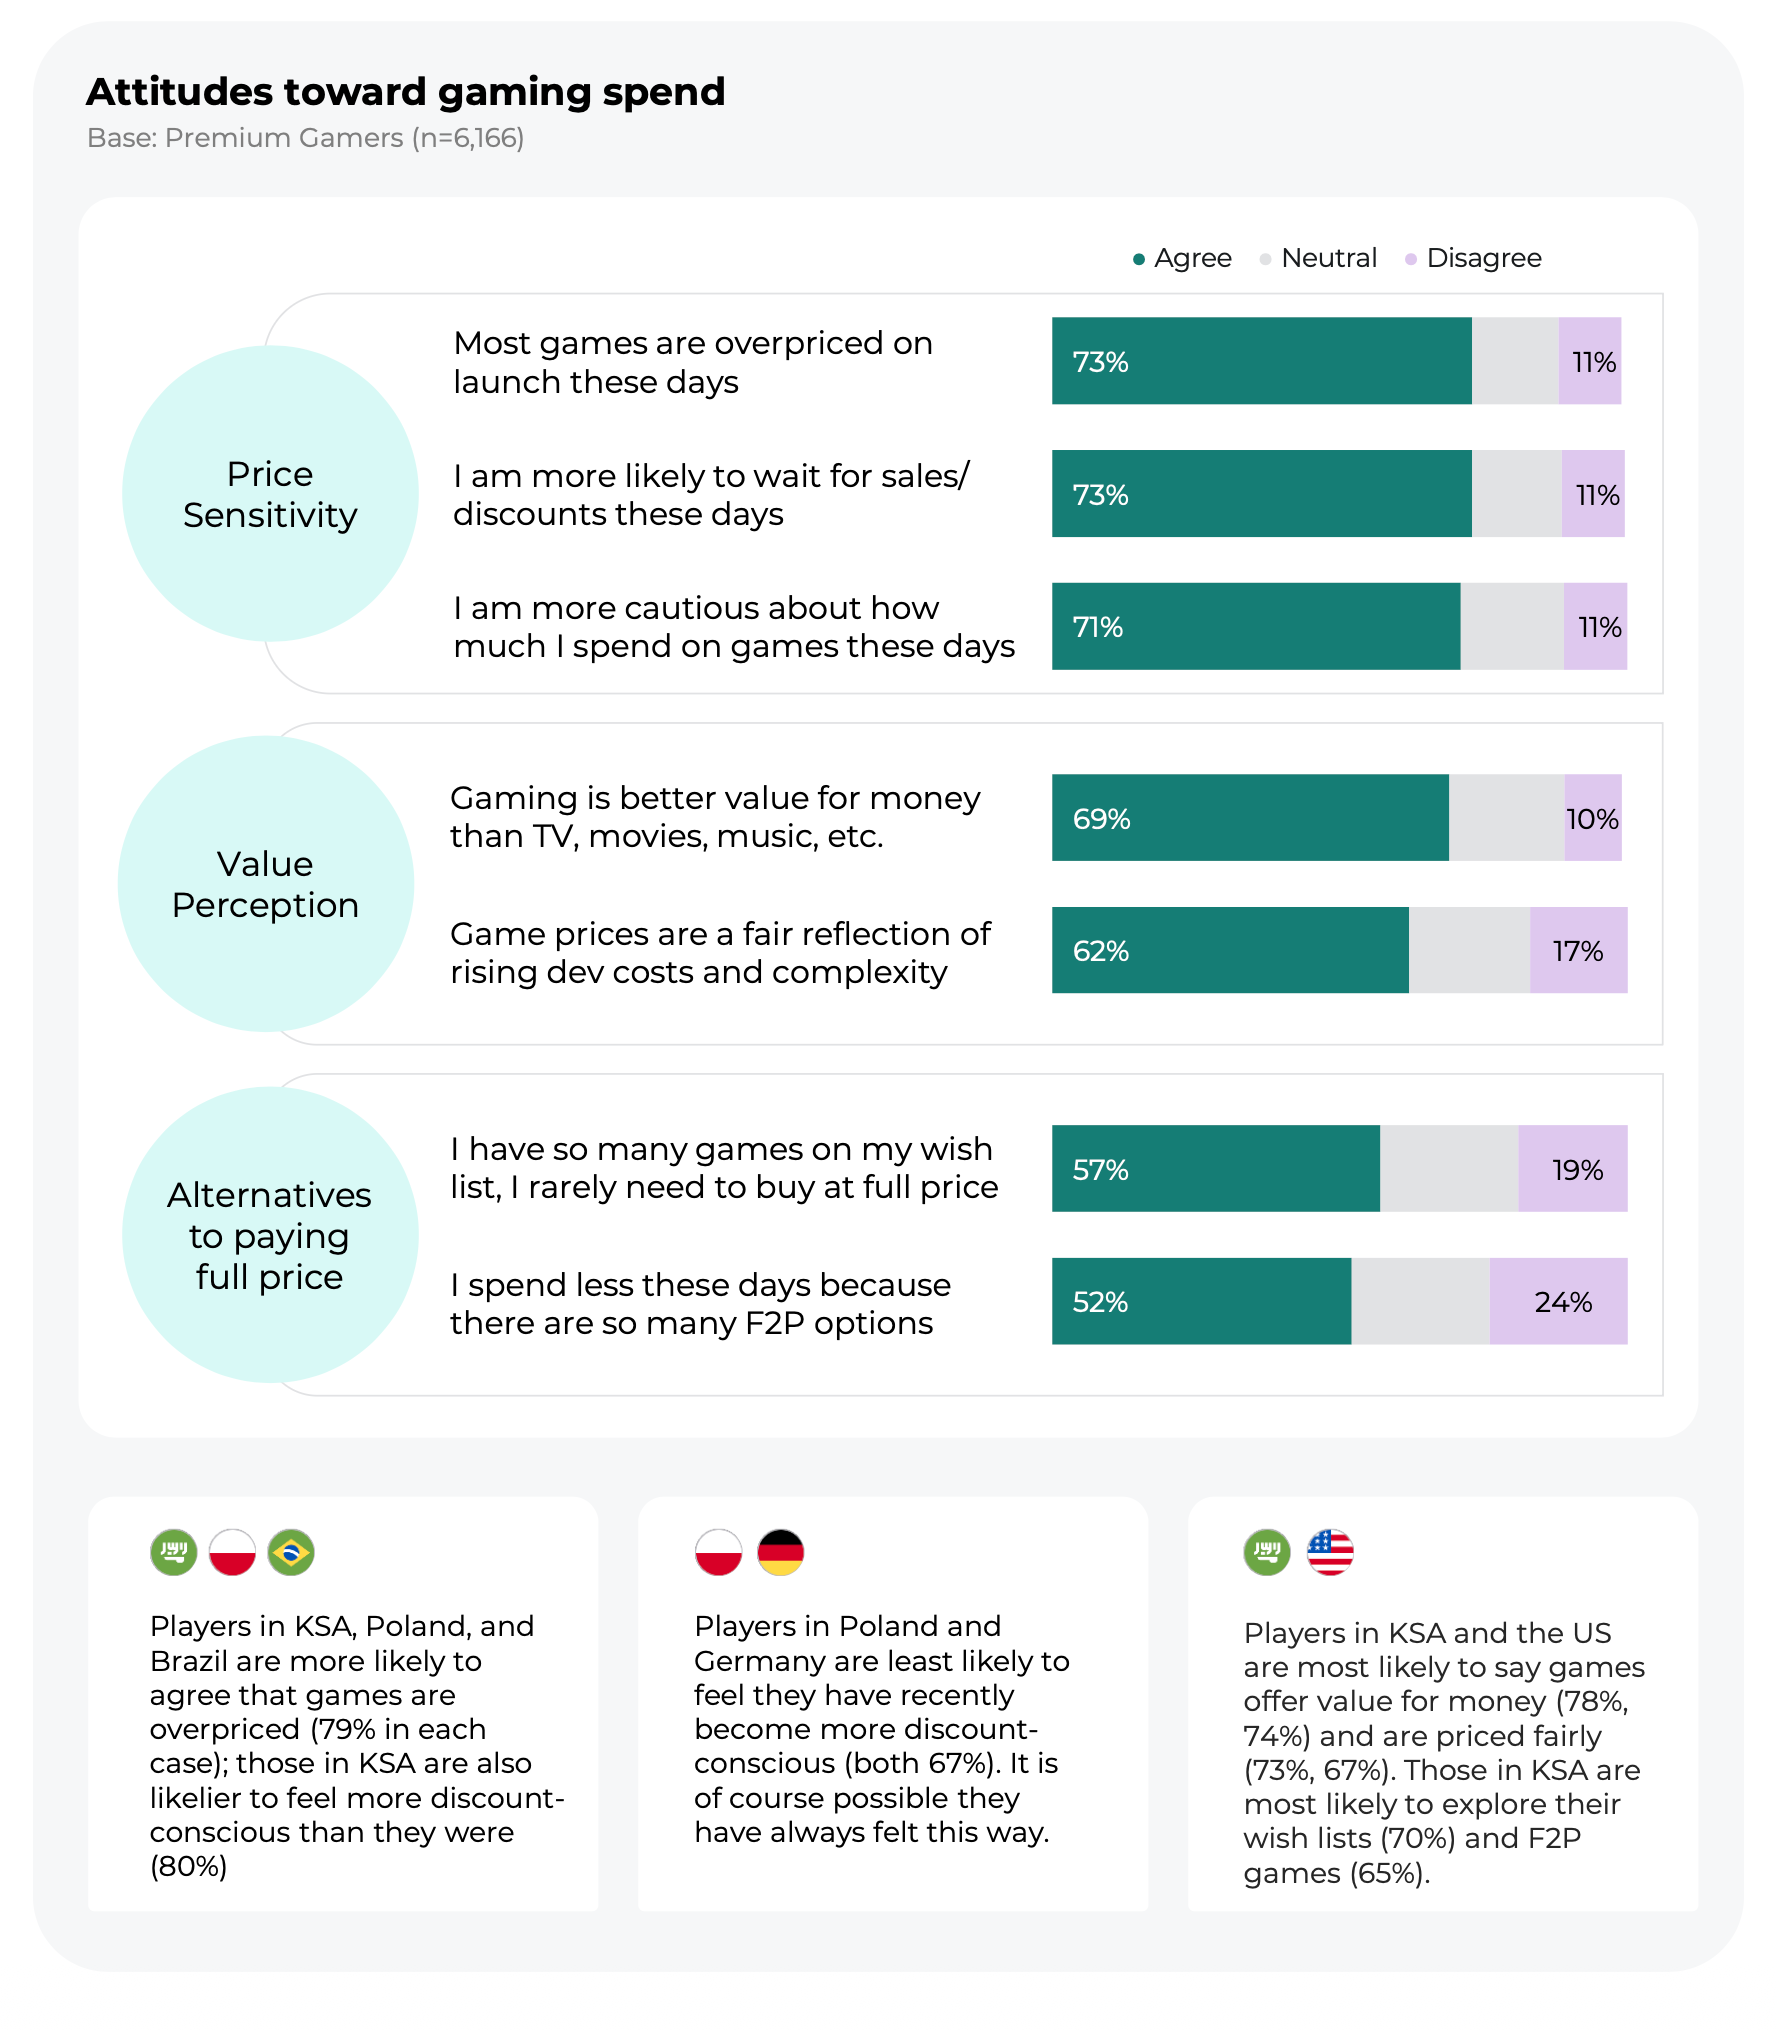
73% of players think most games are too expensive at launch. The same share say they wait for discounts more often now, and 71% say they’ve become more careful about spending on games. Players in Saudi Arabia, Poland, and Brazil are the most likely to call games too expensive (79% each).
-
At the same time, 69% think games give more for the money than TV, movies, and music. 62% agree that game prices reflect rising development costs.
-
Newzoo notes that many players buy cheaper games from their wishlists or play F2P titles while waiting for new releases to go on sale. 57% say they have so many games on their wishlists that they rarely pay full price. 52% spend less because there are so many F2P titles.
-
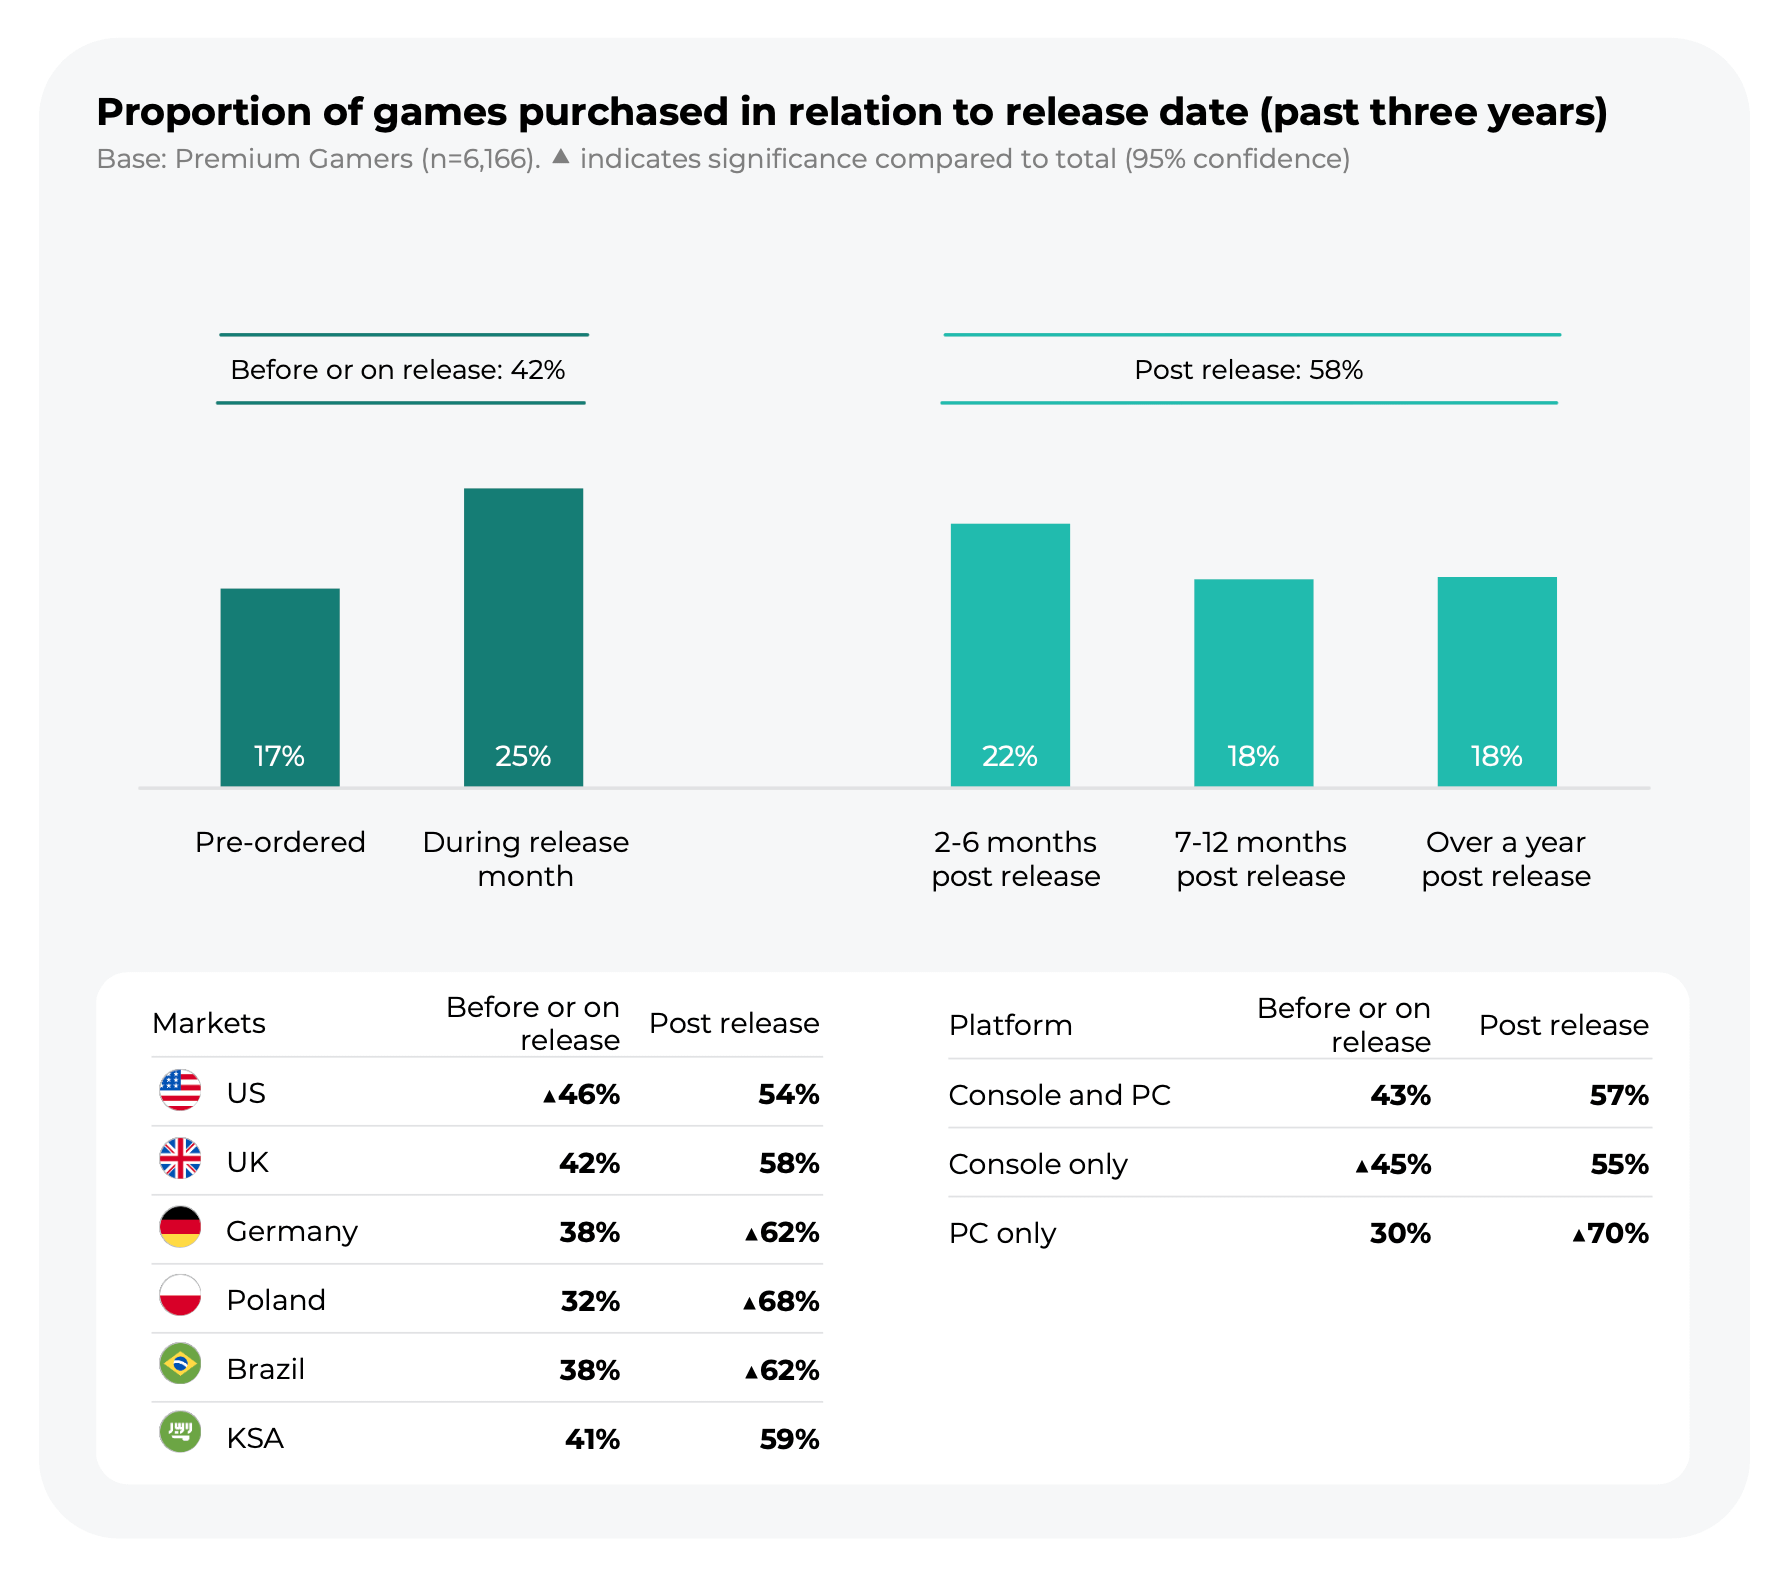
By players’ own estimates, over the past three years, they bought 42% of games before release or in the release month (17% pre-orders, 25% in the release month). The remaining 58% were bought later, and 18% of all games were bought more than a year after release.
-
Players in the US buy earliest: 46% of games before release or in the release month. Players in Poland wait the longest (68% of purchases after the release month).
-
PC-only players buy 70% of their games after the release month.
❗️For comparison, according to Alinea Analytics, games released in 2026 accounted for just 21% of Steam revenue in H1’26.
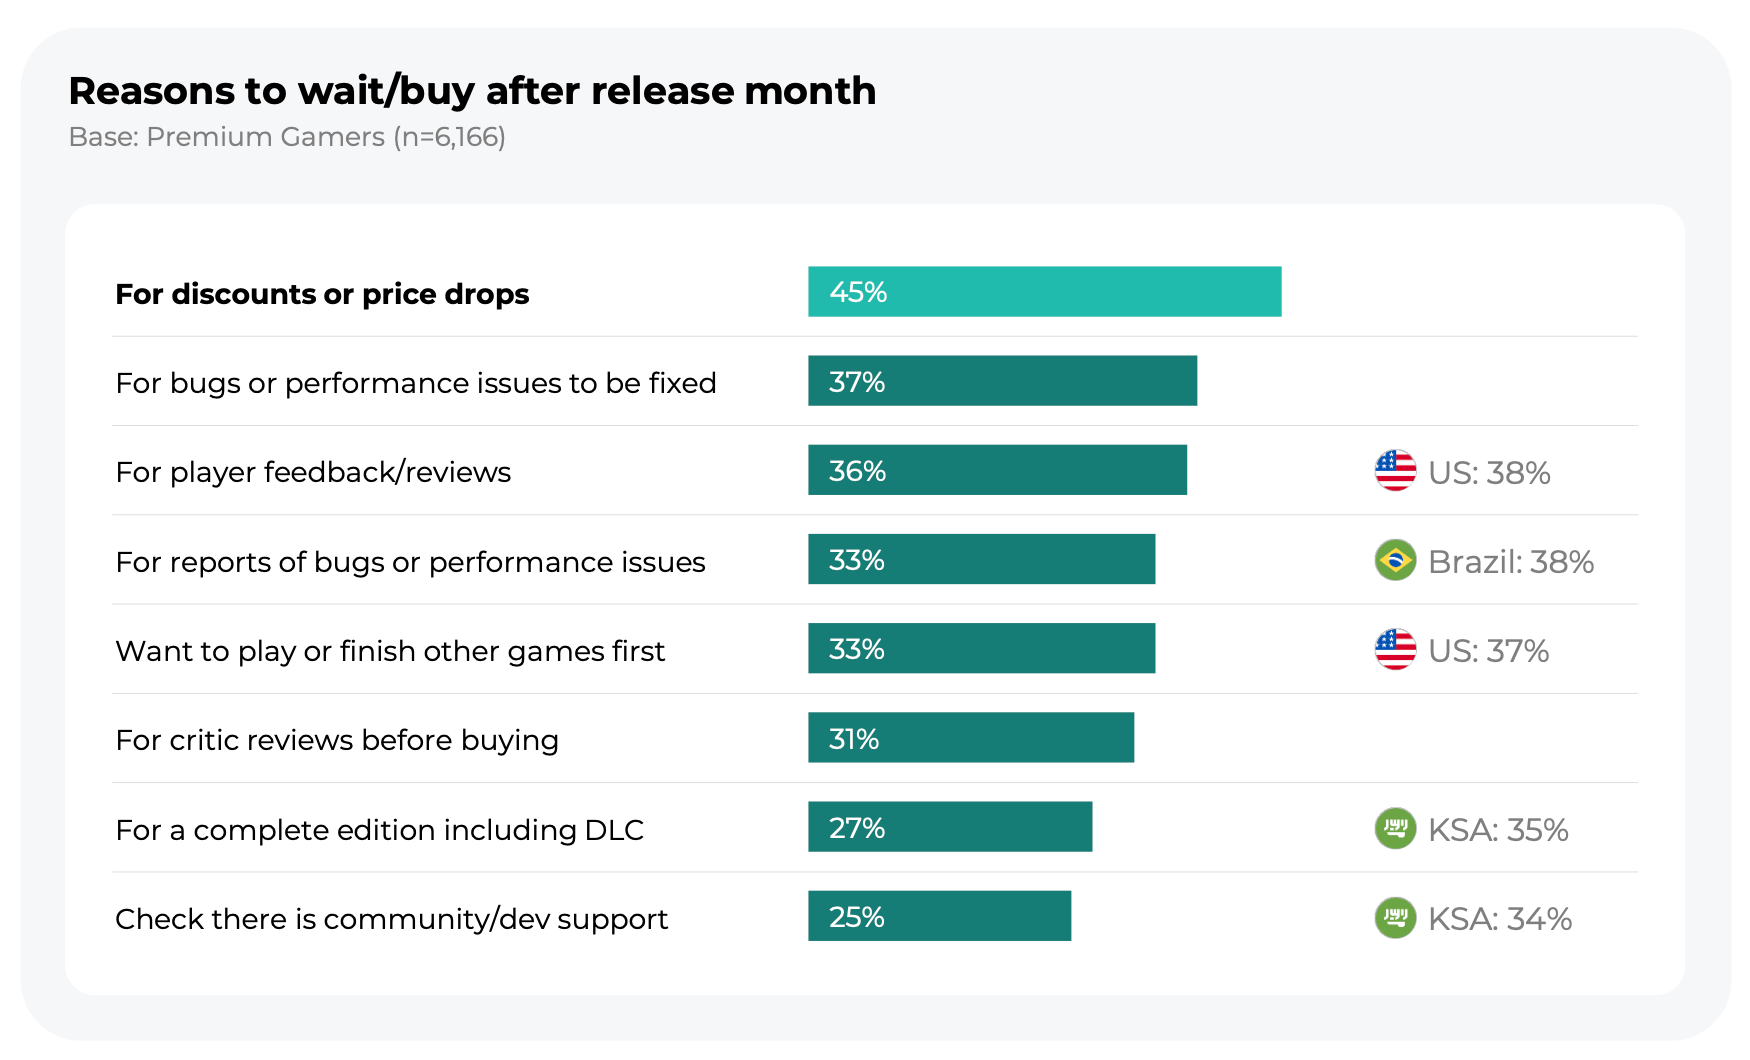
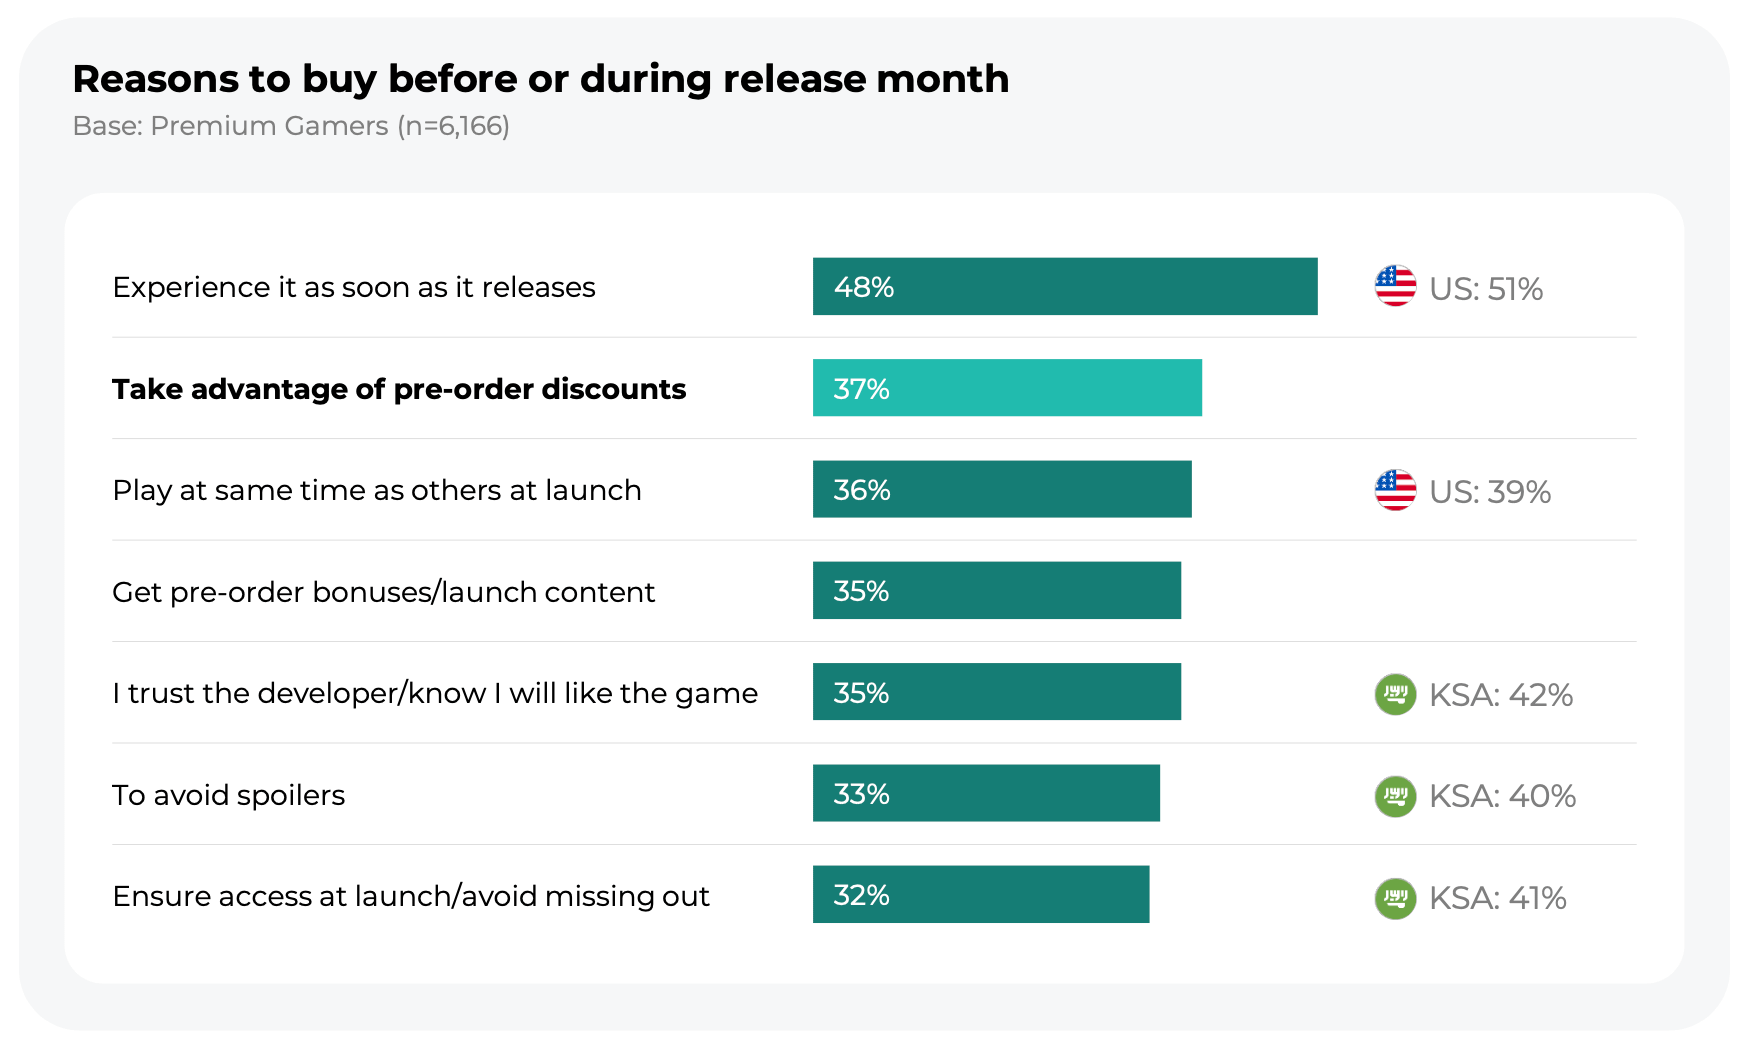
-
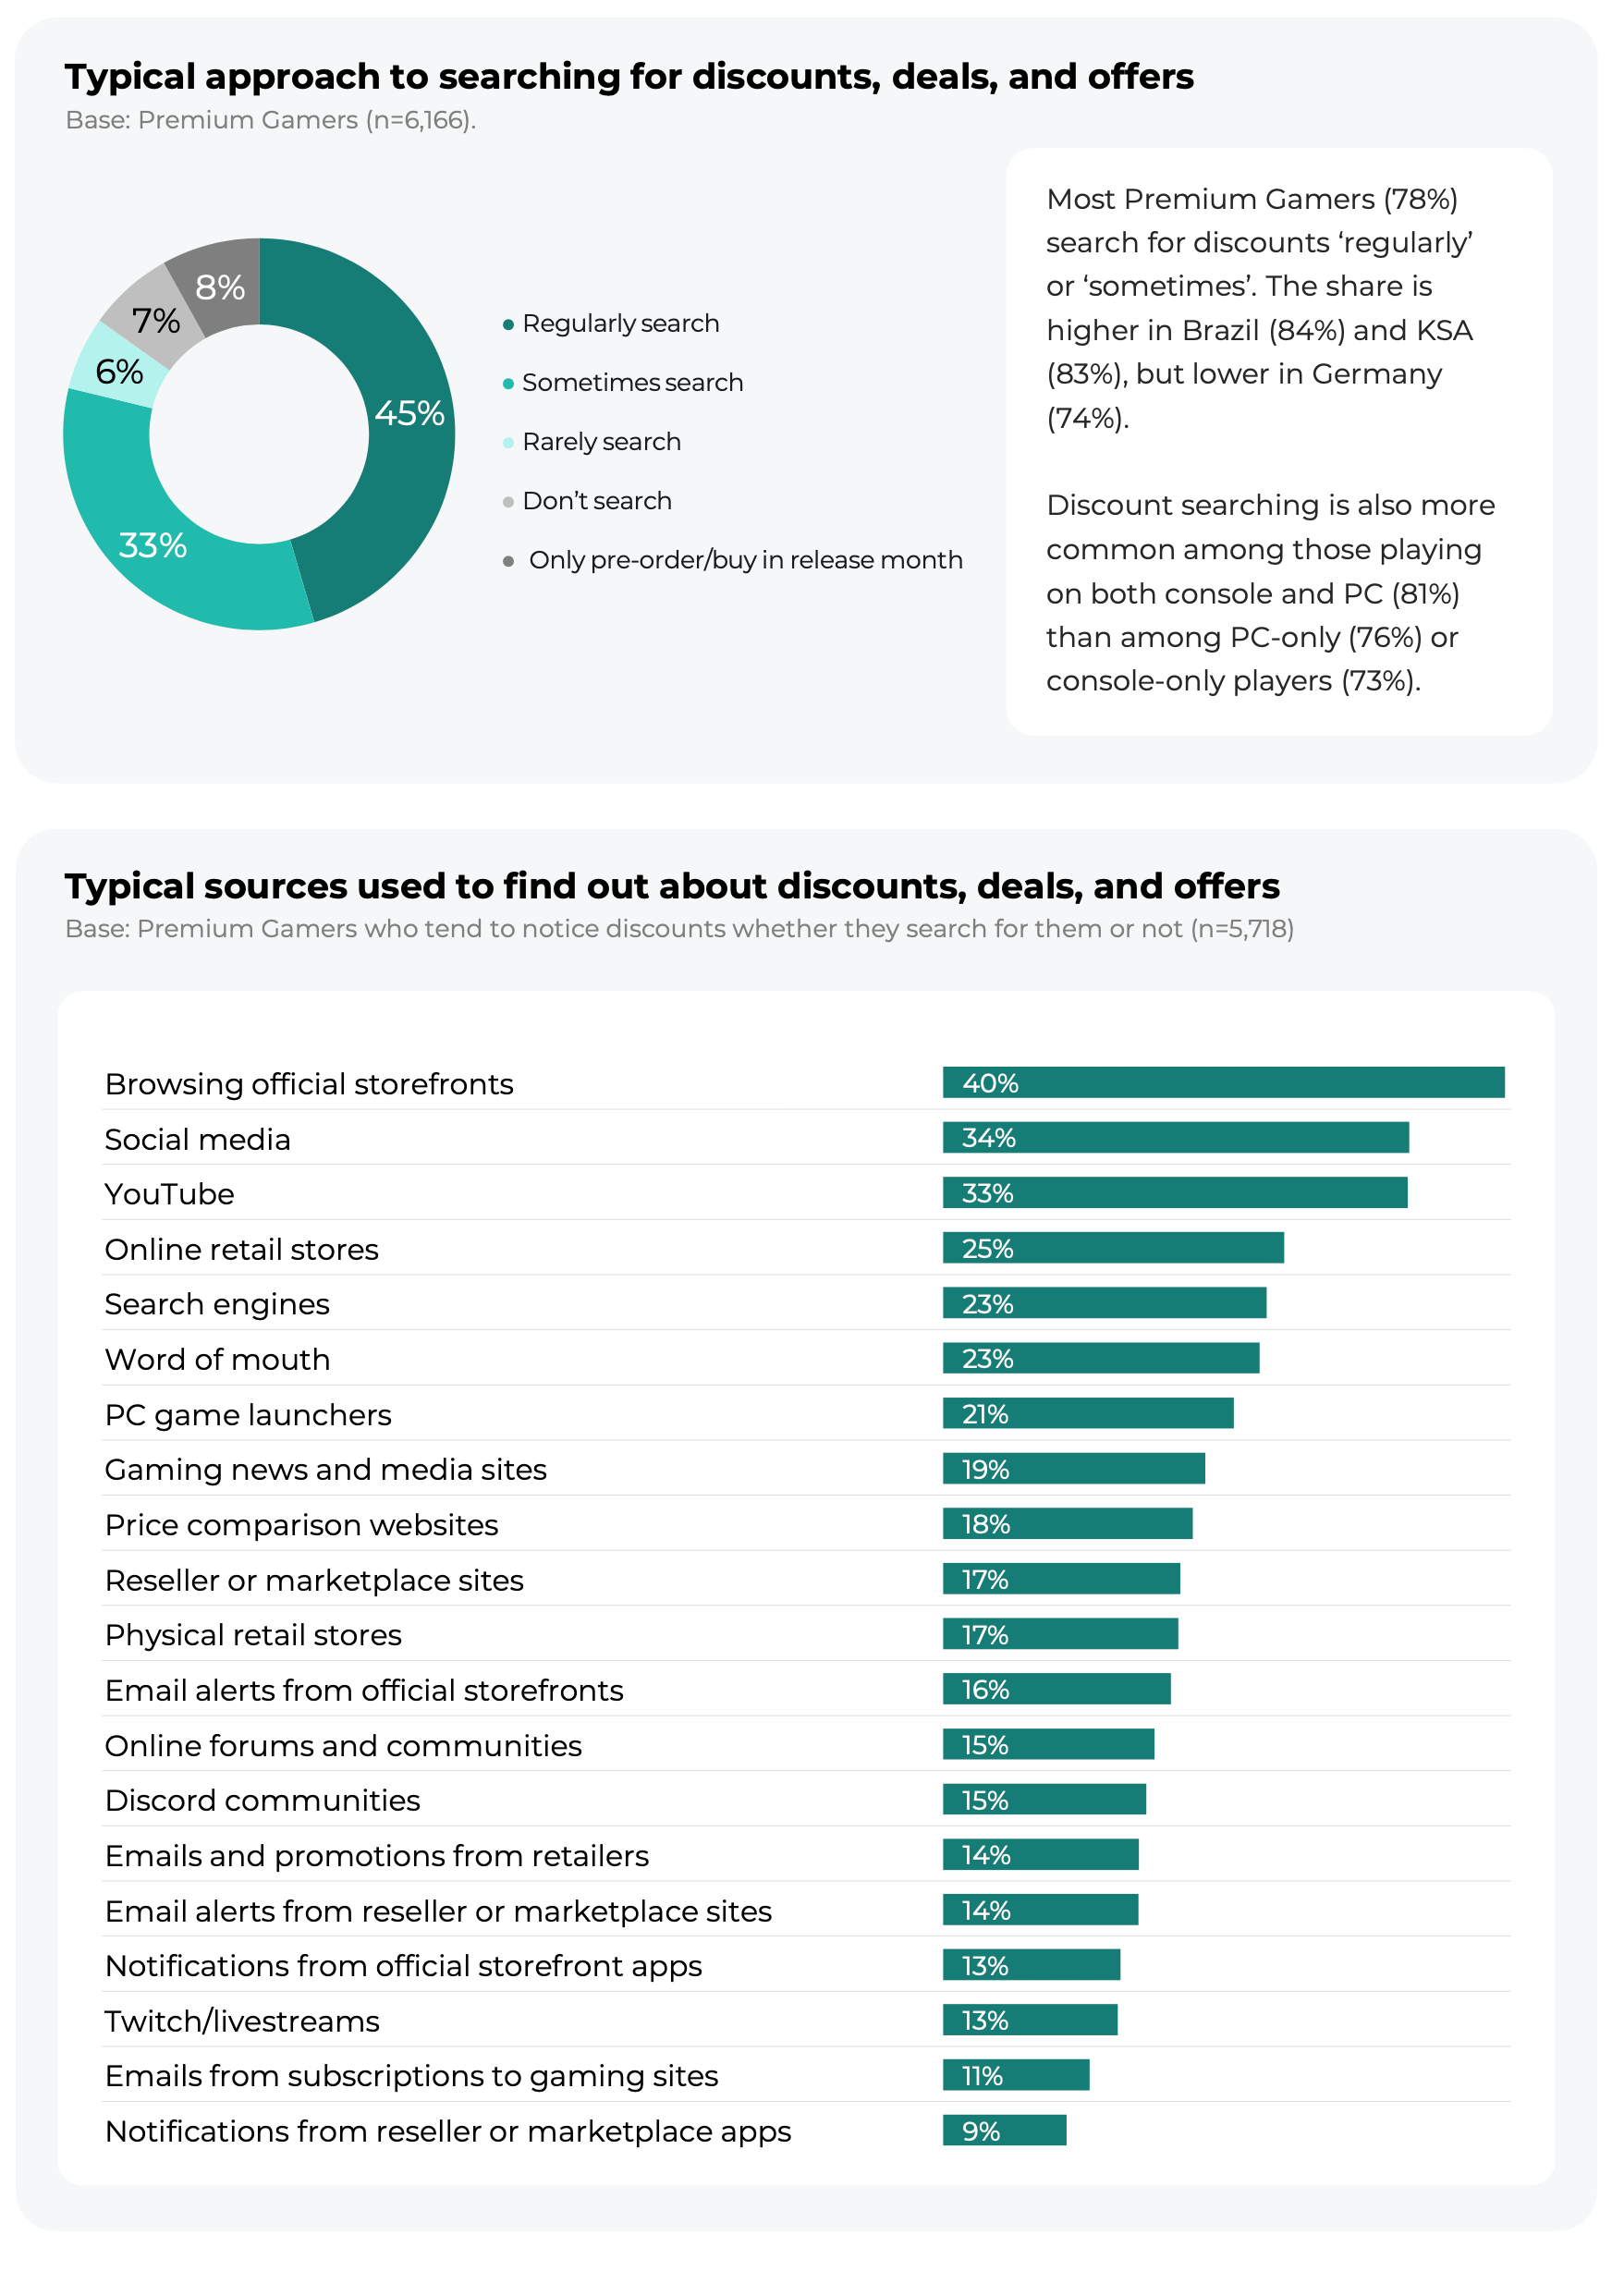
78% of players search for discounts regularly or sometimes (45% regularly). The share is highest in Brazil (84%) and Saudi Arabia (83%), and lowest in Germany (74%).
-
Players mostly learn about discounts from official storefronts (40%), social media (34%), and YouTube (33%). 17% mention reseller and marketplace sites.
-
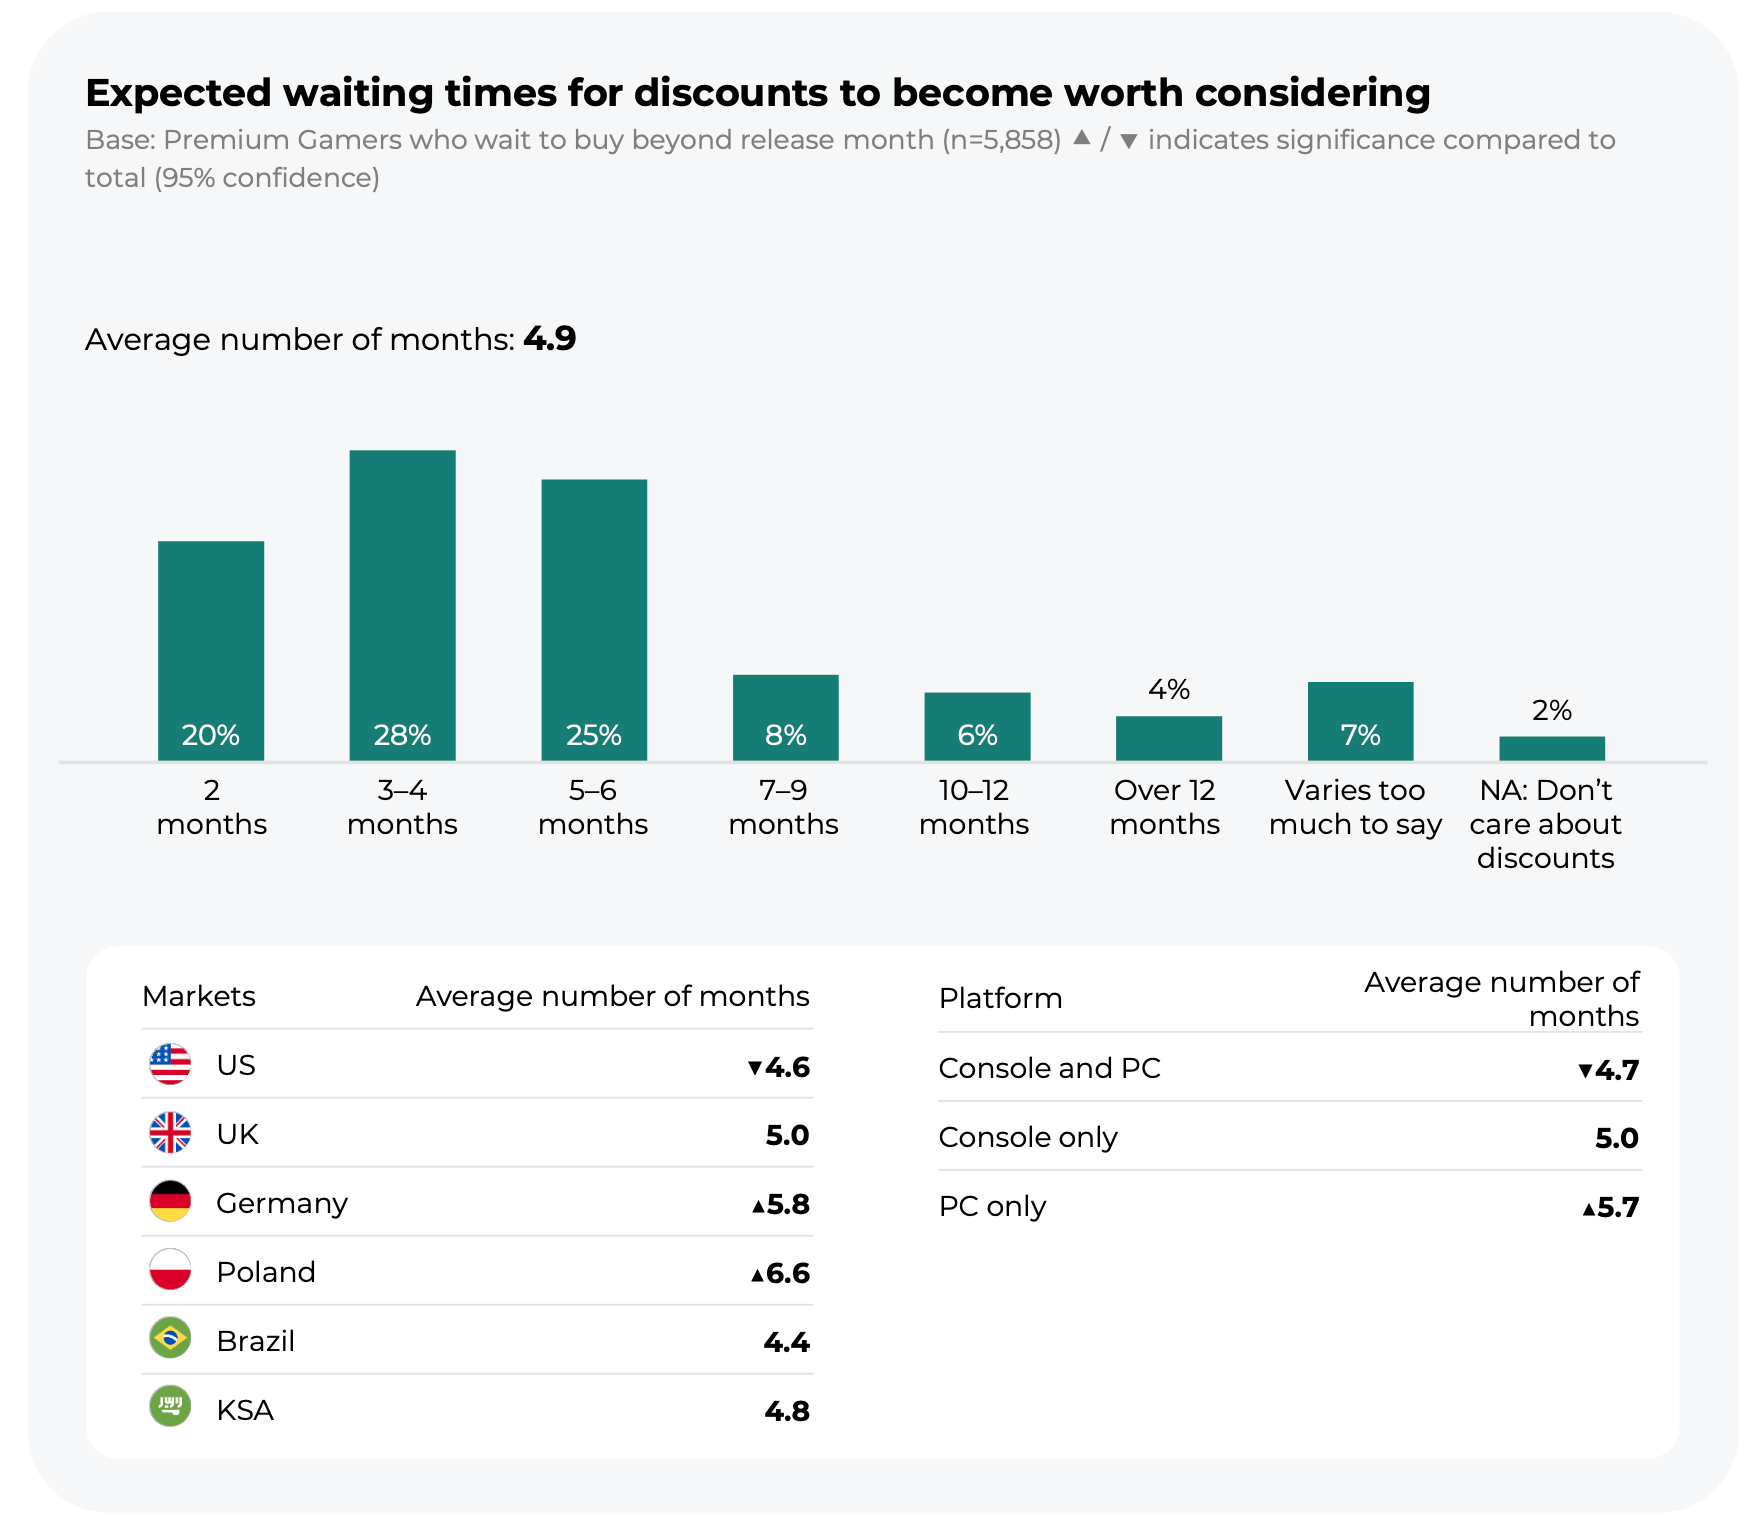
On average, players are willing to wait 4.9 months for a game discount to become interesting. The most common answer is 3-4 months (28%). Players in Poland (6.6 months) and Germany (5.8 months) are willing to wait the longest, while those in Brazil (4.4 months) and the US (4.6 months) wait the least.
-
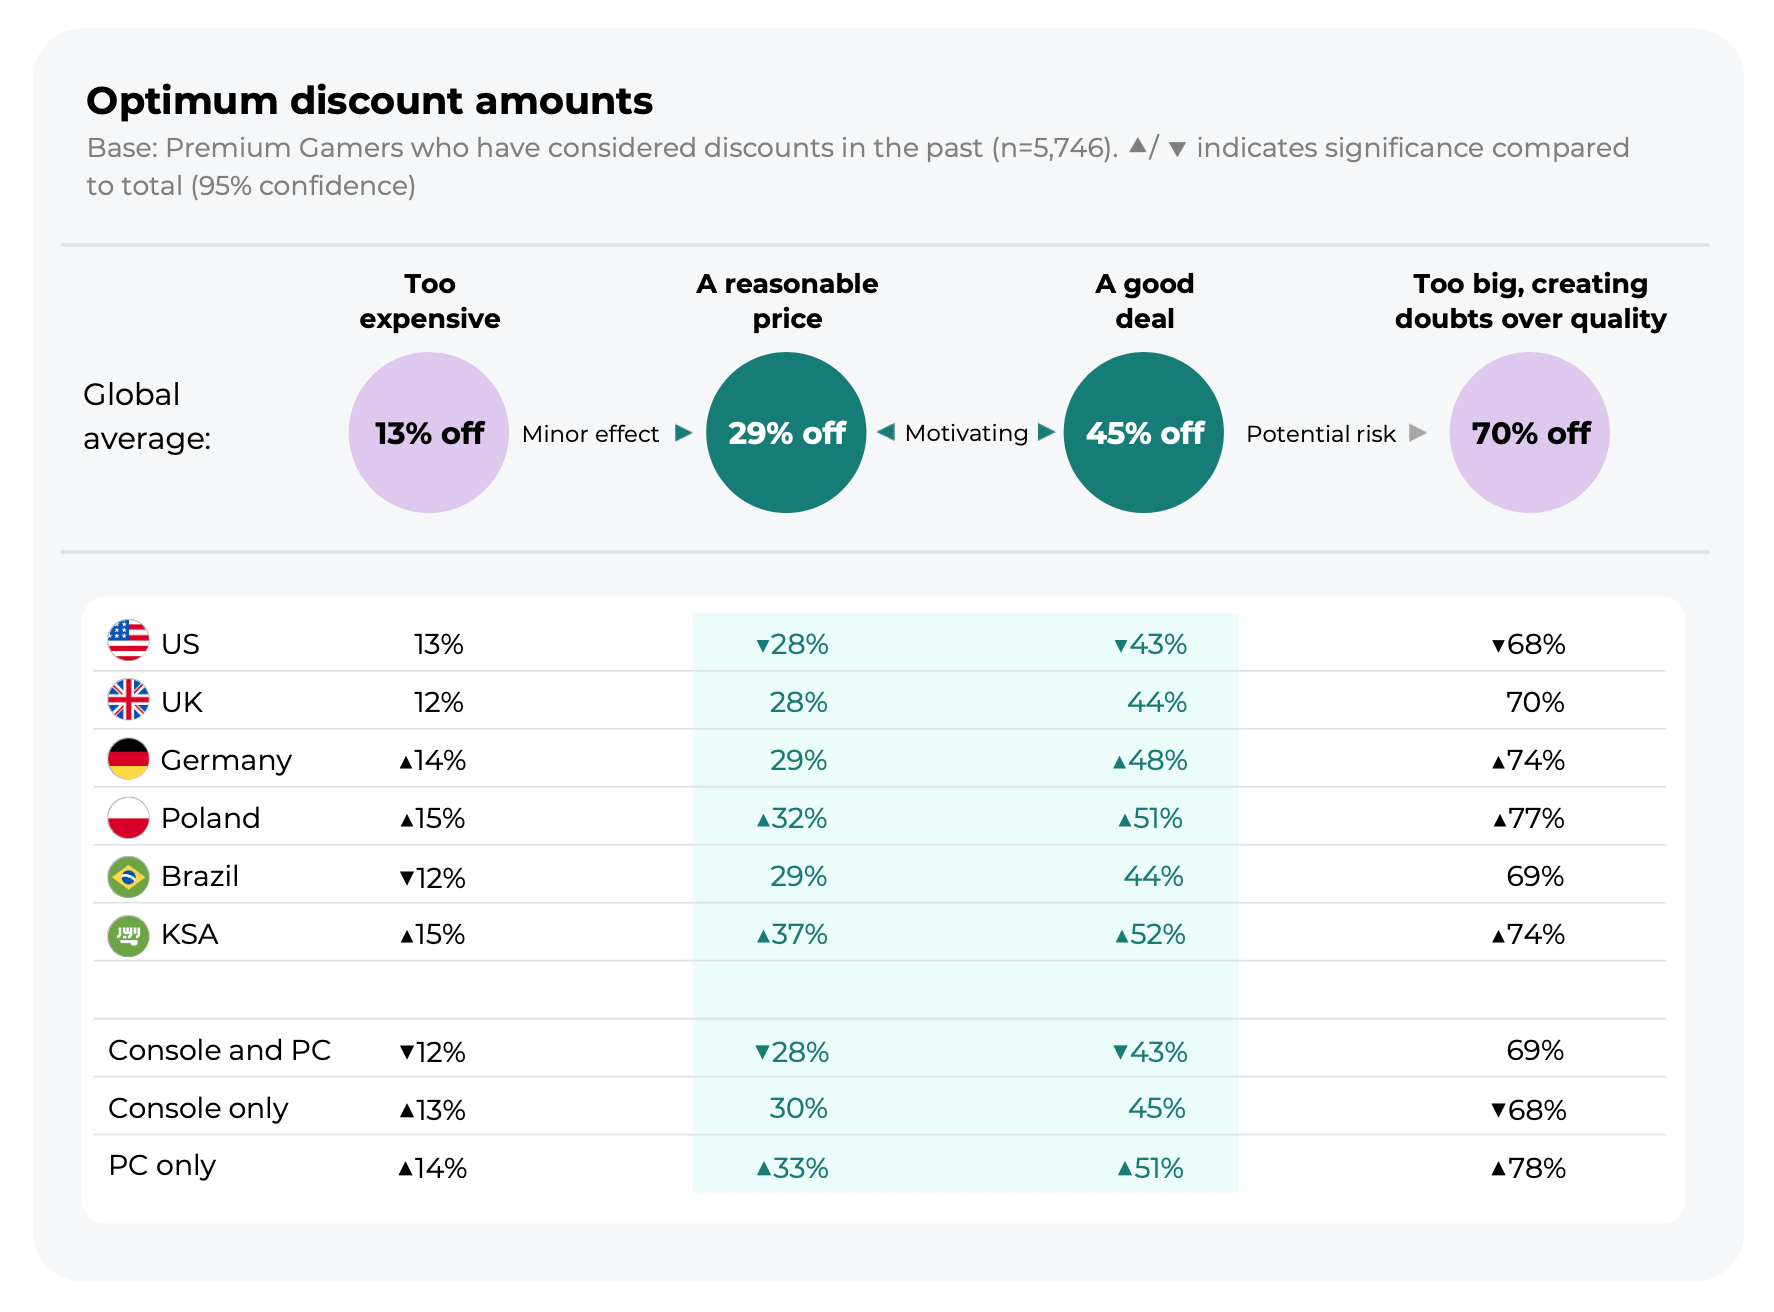
A 13% discount has almost no effect: the game still feels expensive. At 29% off, the price starts to feel reasonable, and at 45% off, it feels like a good deal. A 70% discount, though, already raises doubts about the game’s quality.
-
In the US, the price feels reasonable at 28% off and like a good deal at 43% off. PC-only players expect more generous discounts.
-
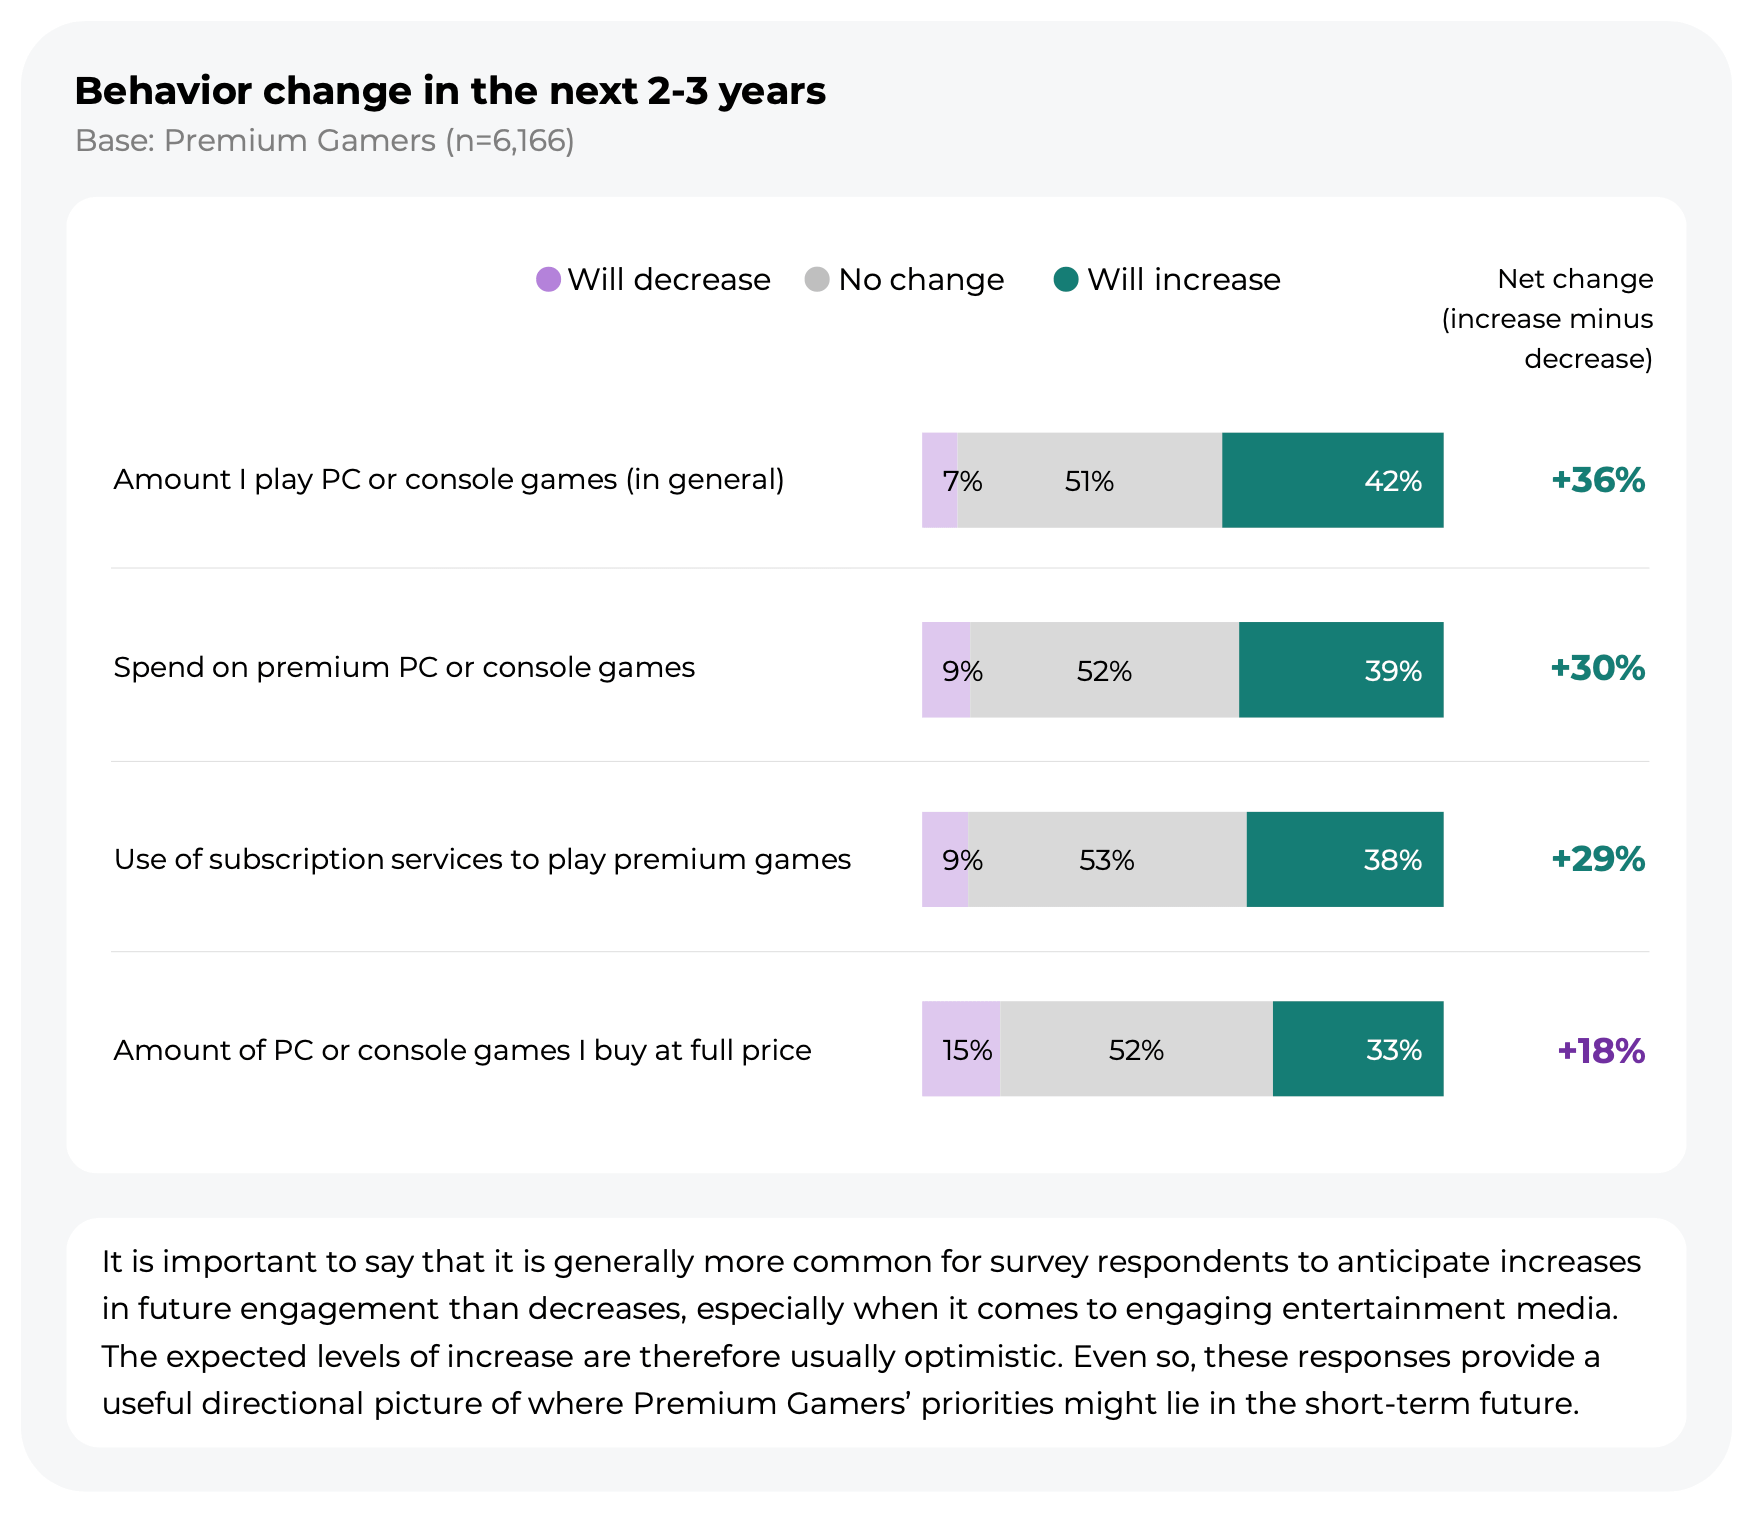
Over the next 2-3 years, 42% of players plan to play more on PC and console (7% plan to play less). 39% expect to spend more on premium games, and 38% to use subscriptions more. But only 33% plan to buy more games at full price (15% plan to buy fewer games at full price).
❗️Newzoo itself notes that survey respondents more often expect engagement to rise than to fall, so expectations are usually more optimistic than reality.
-
Game Pass and PS Plus (Extra or Premium) are each used by 38% of respondents, EA Play by 28%, and Ubisoft+ by 14%. Among console-only players, PS Plus leads (38% vs. 22% for Game Pass).
-
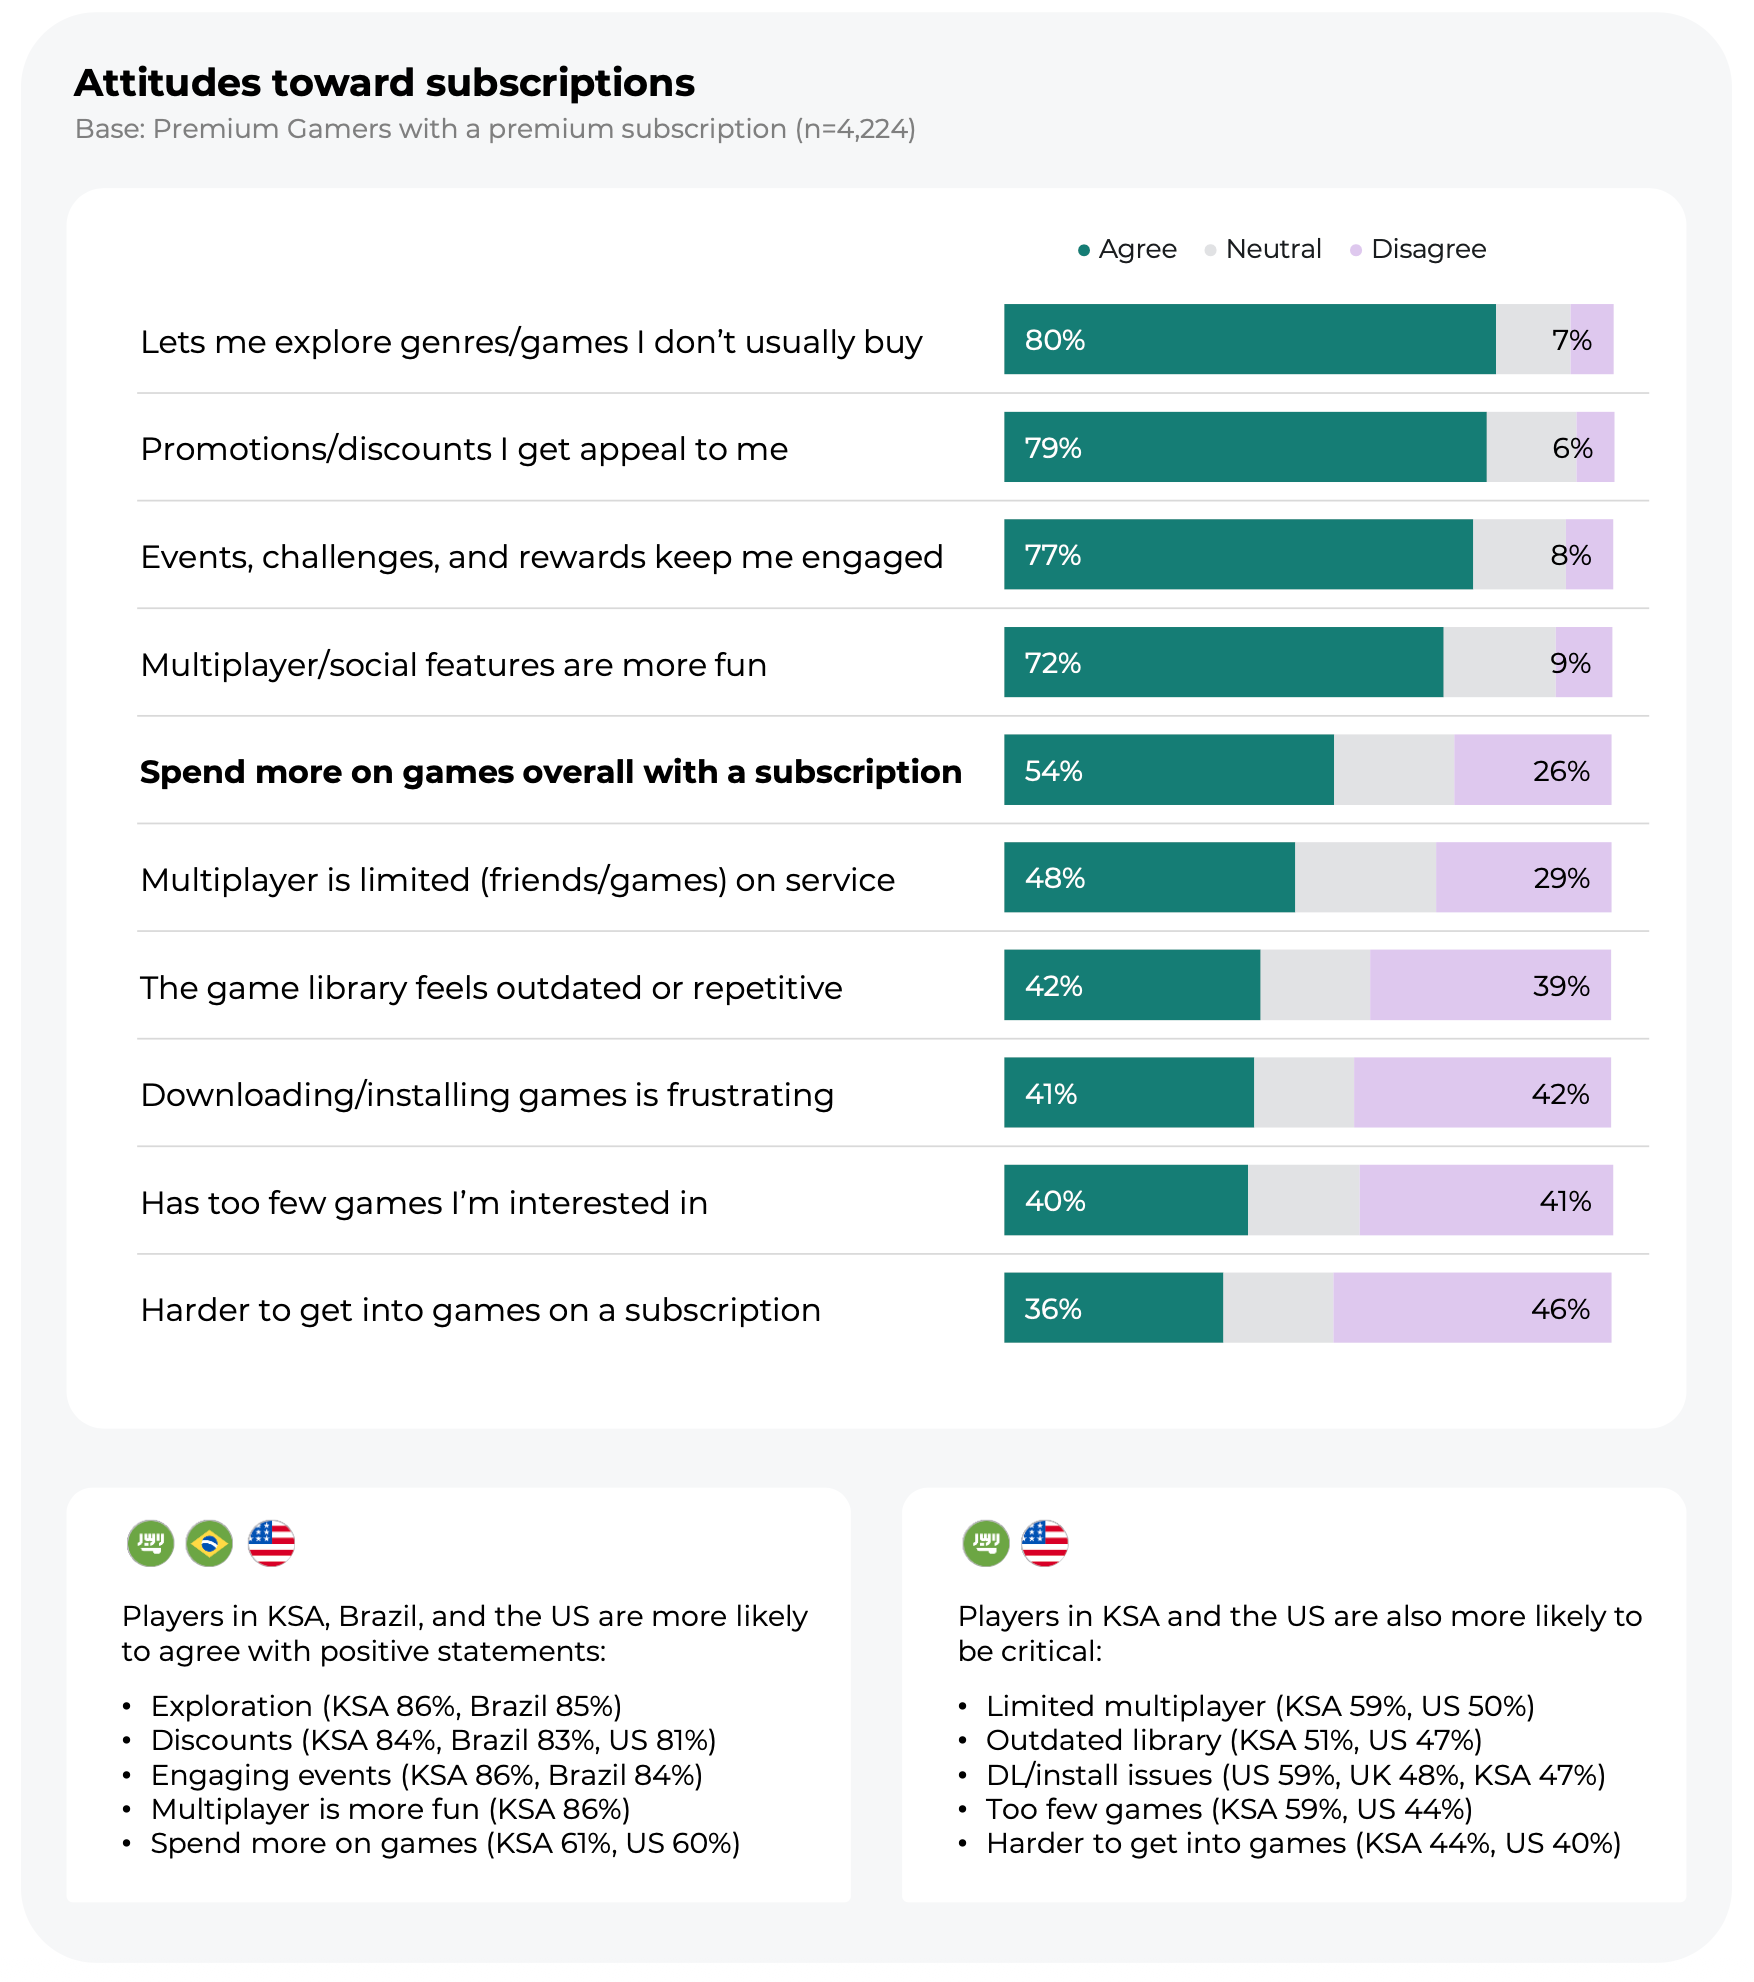
80% of subscribers say a subscription lets them try genres and games they don’t usually buy. 79% like the discounts and promotions, and 77% like the events and rewards.
-
54% of subscribers say they’ve spent more on games overall since subscribing. Newzoo suggests this includes both the subscription fee itself and in-game purchases.
-
That said, 42% of subscribers feel the subscription library is outdated or repetitive.
-
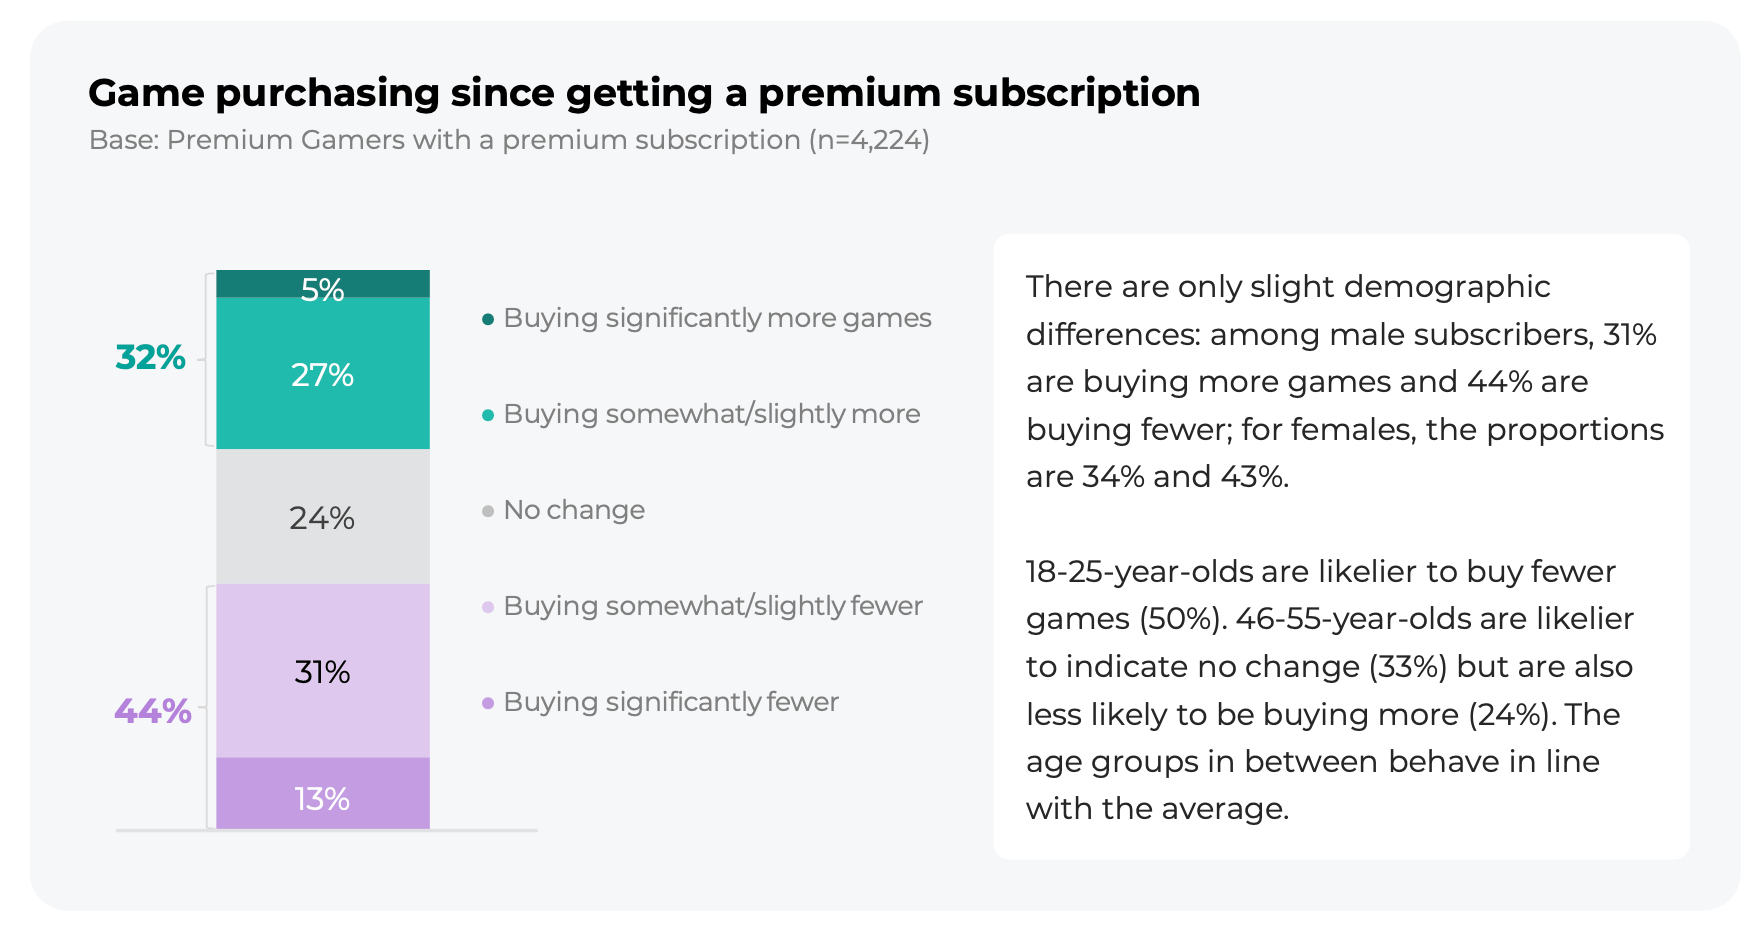
44% of subscription users have started buying fewer games (13% significantly fewer). 32%, on the other hand, buy more, and 24% report no change.
-
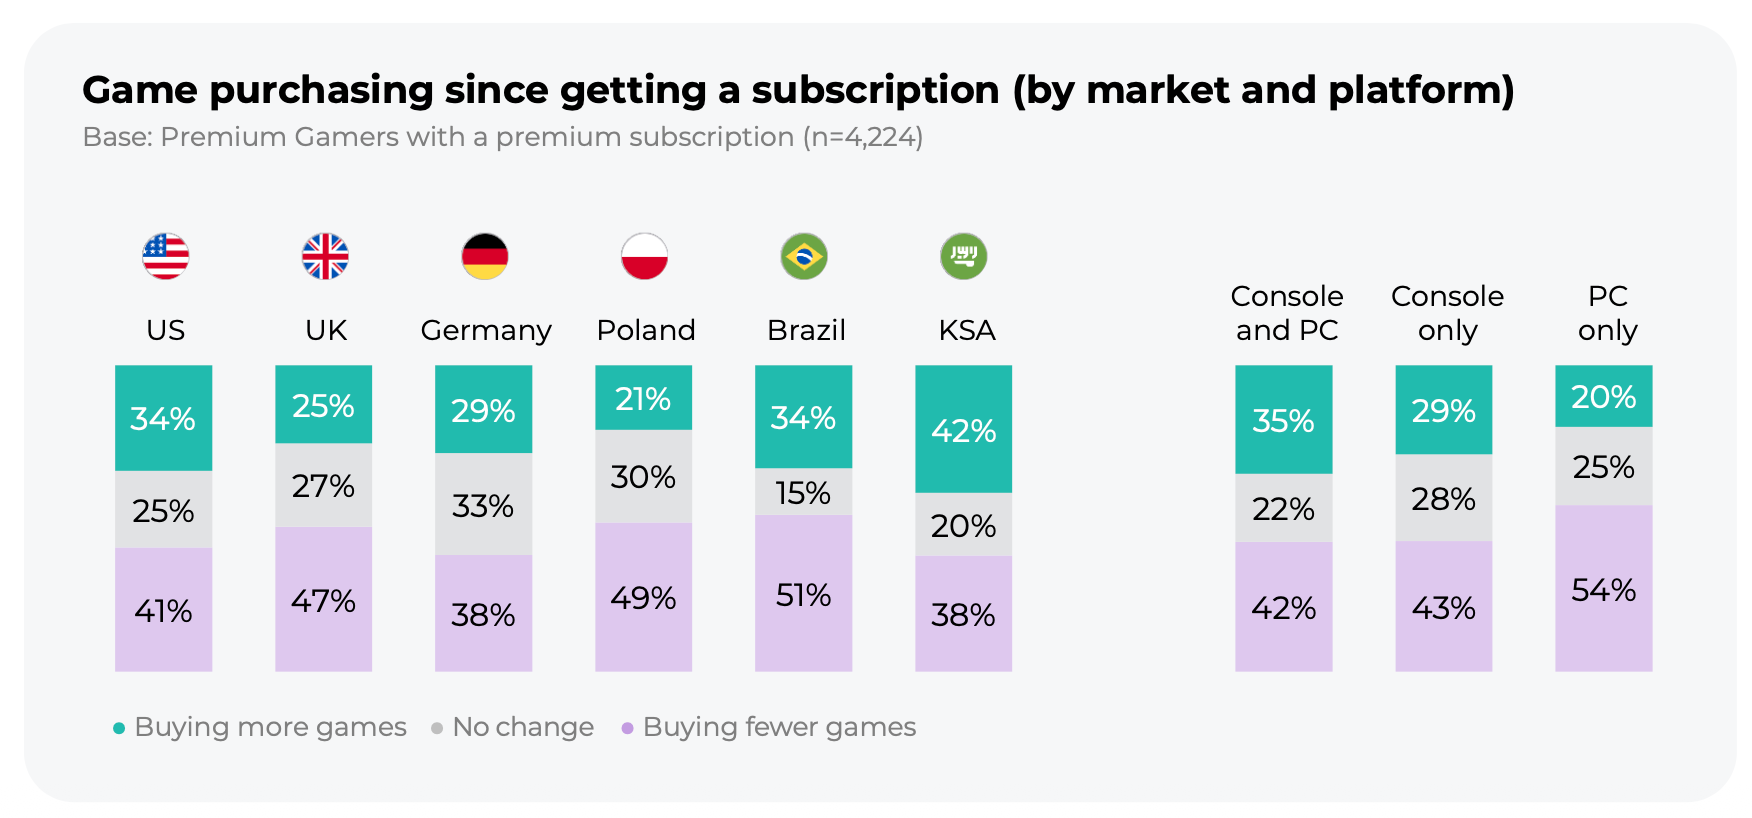
Subscriptions reduce purchases the most in Poland: 49% buy fewer games, and only 21% buy more. In Saudi Arabia, by contrast, more subscribers buy more games (42%) than fewer (38%). Among PC-only players, 54% buy fewer games.
-
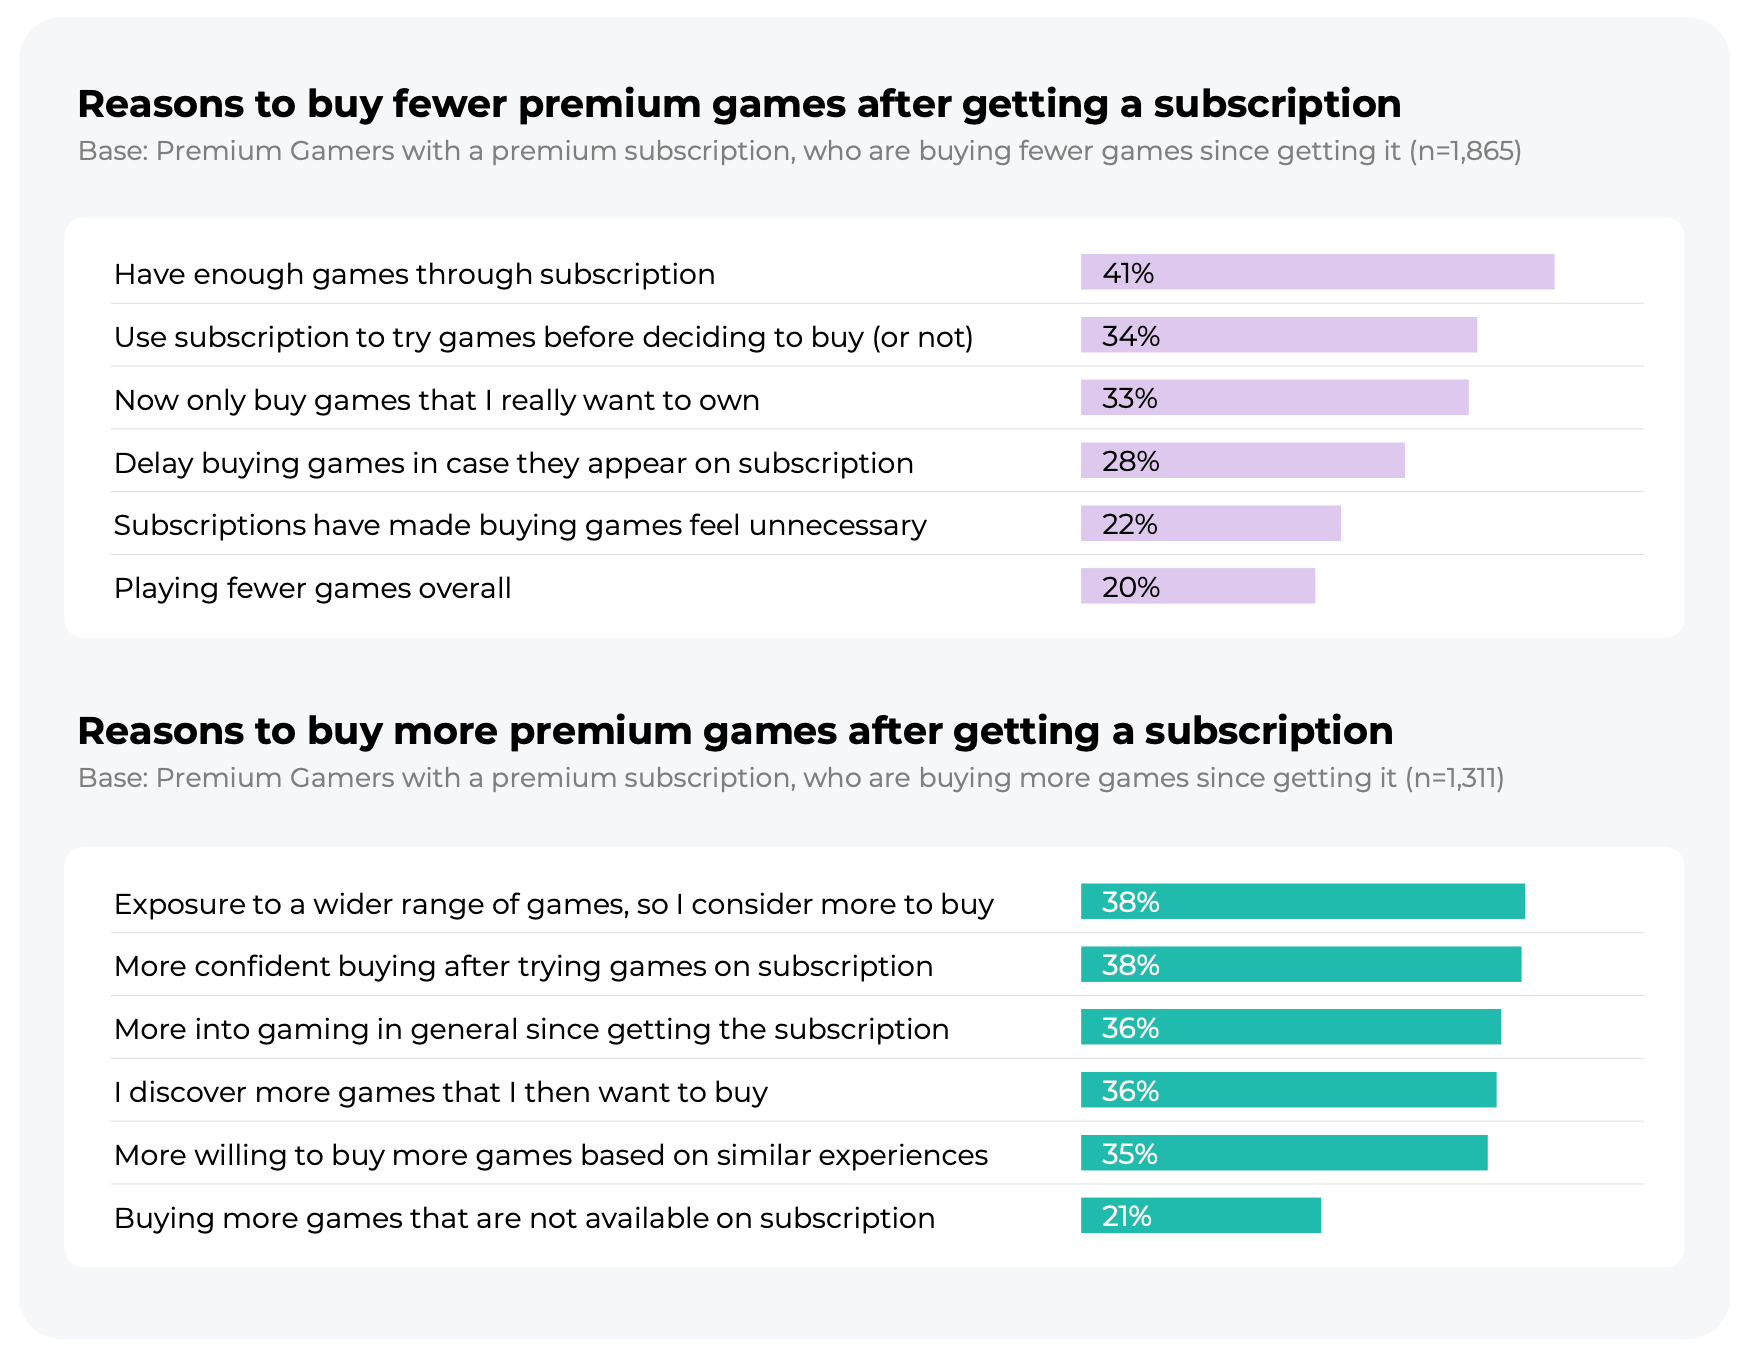
Players buy fewer games mainly because they have enough games in the subscription (41%), and because they try games on the subscription before buying (34%). Only 22% say buying games has become unnecessary altogether.
-
Those who buy more say they discover more games (38%) and are more inclined to buy after trying a game on the subscription (38%).

-
Players are more likely to make in-game purchases in subscription games: 32-36% of subscribers are more likely to buy add-ons or cosmetics in a subscription game, compared with only 15-19% in a game they own. Newzoo links this to players saving on the game itself.
A word from our sponsor
You found the right contractor, and they said yes. Now there’s a contract to draft, an NDA to sign, and a cross-border payment to set up. Mellow handles all of it in one flow — contracts with IP and NDA clauses, compliant payments, and every document in one place.
-
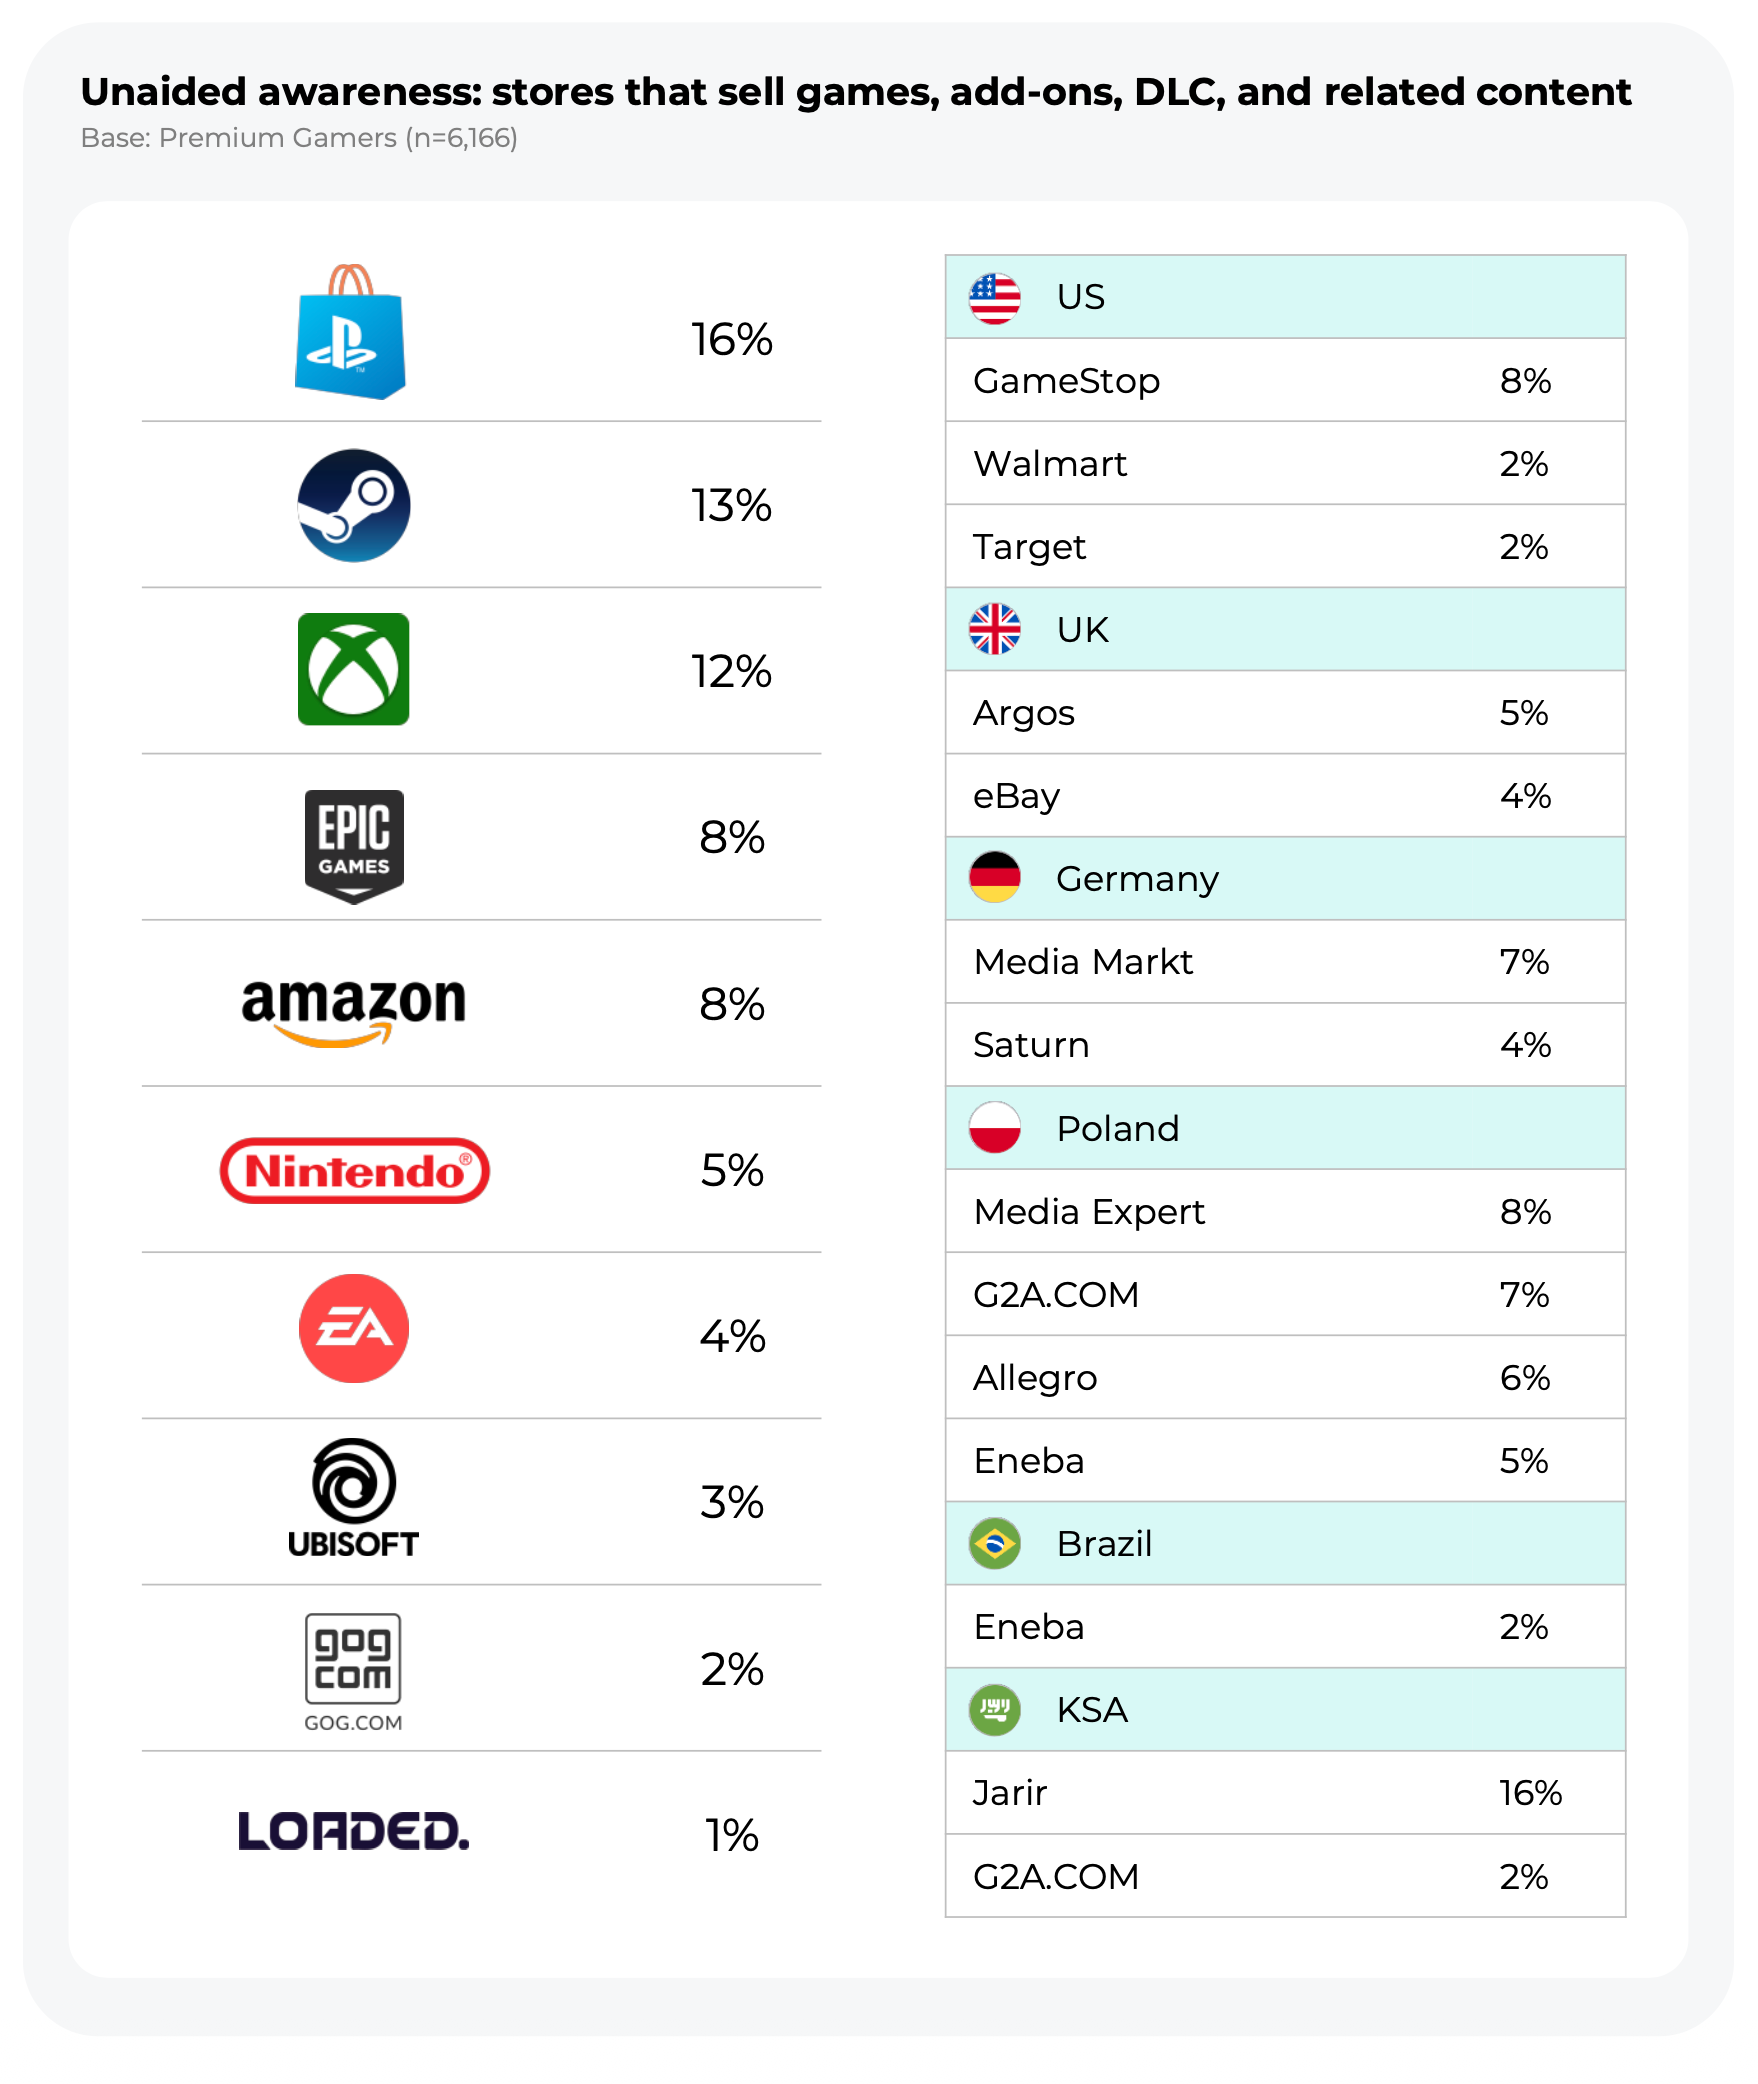
When asked to name stores that sell games without prompting, players most often name PlayStation Store (16%), Steam (13%), and Xbox Store (12%).
-
Among stores not owned by platforms or publishers, only Amazon (8%) and reseller Loaded (formerly CDKeys, 1%) made the top 10. In Poland, players often name marketplaces such as G2A.COM (7%), Allegro (6%), and Eneba (5%). In Saudi Arabia, the local chain Jarir is mentioned most often (16%).
-
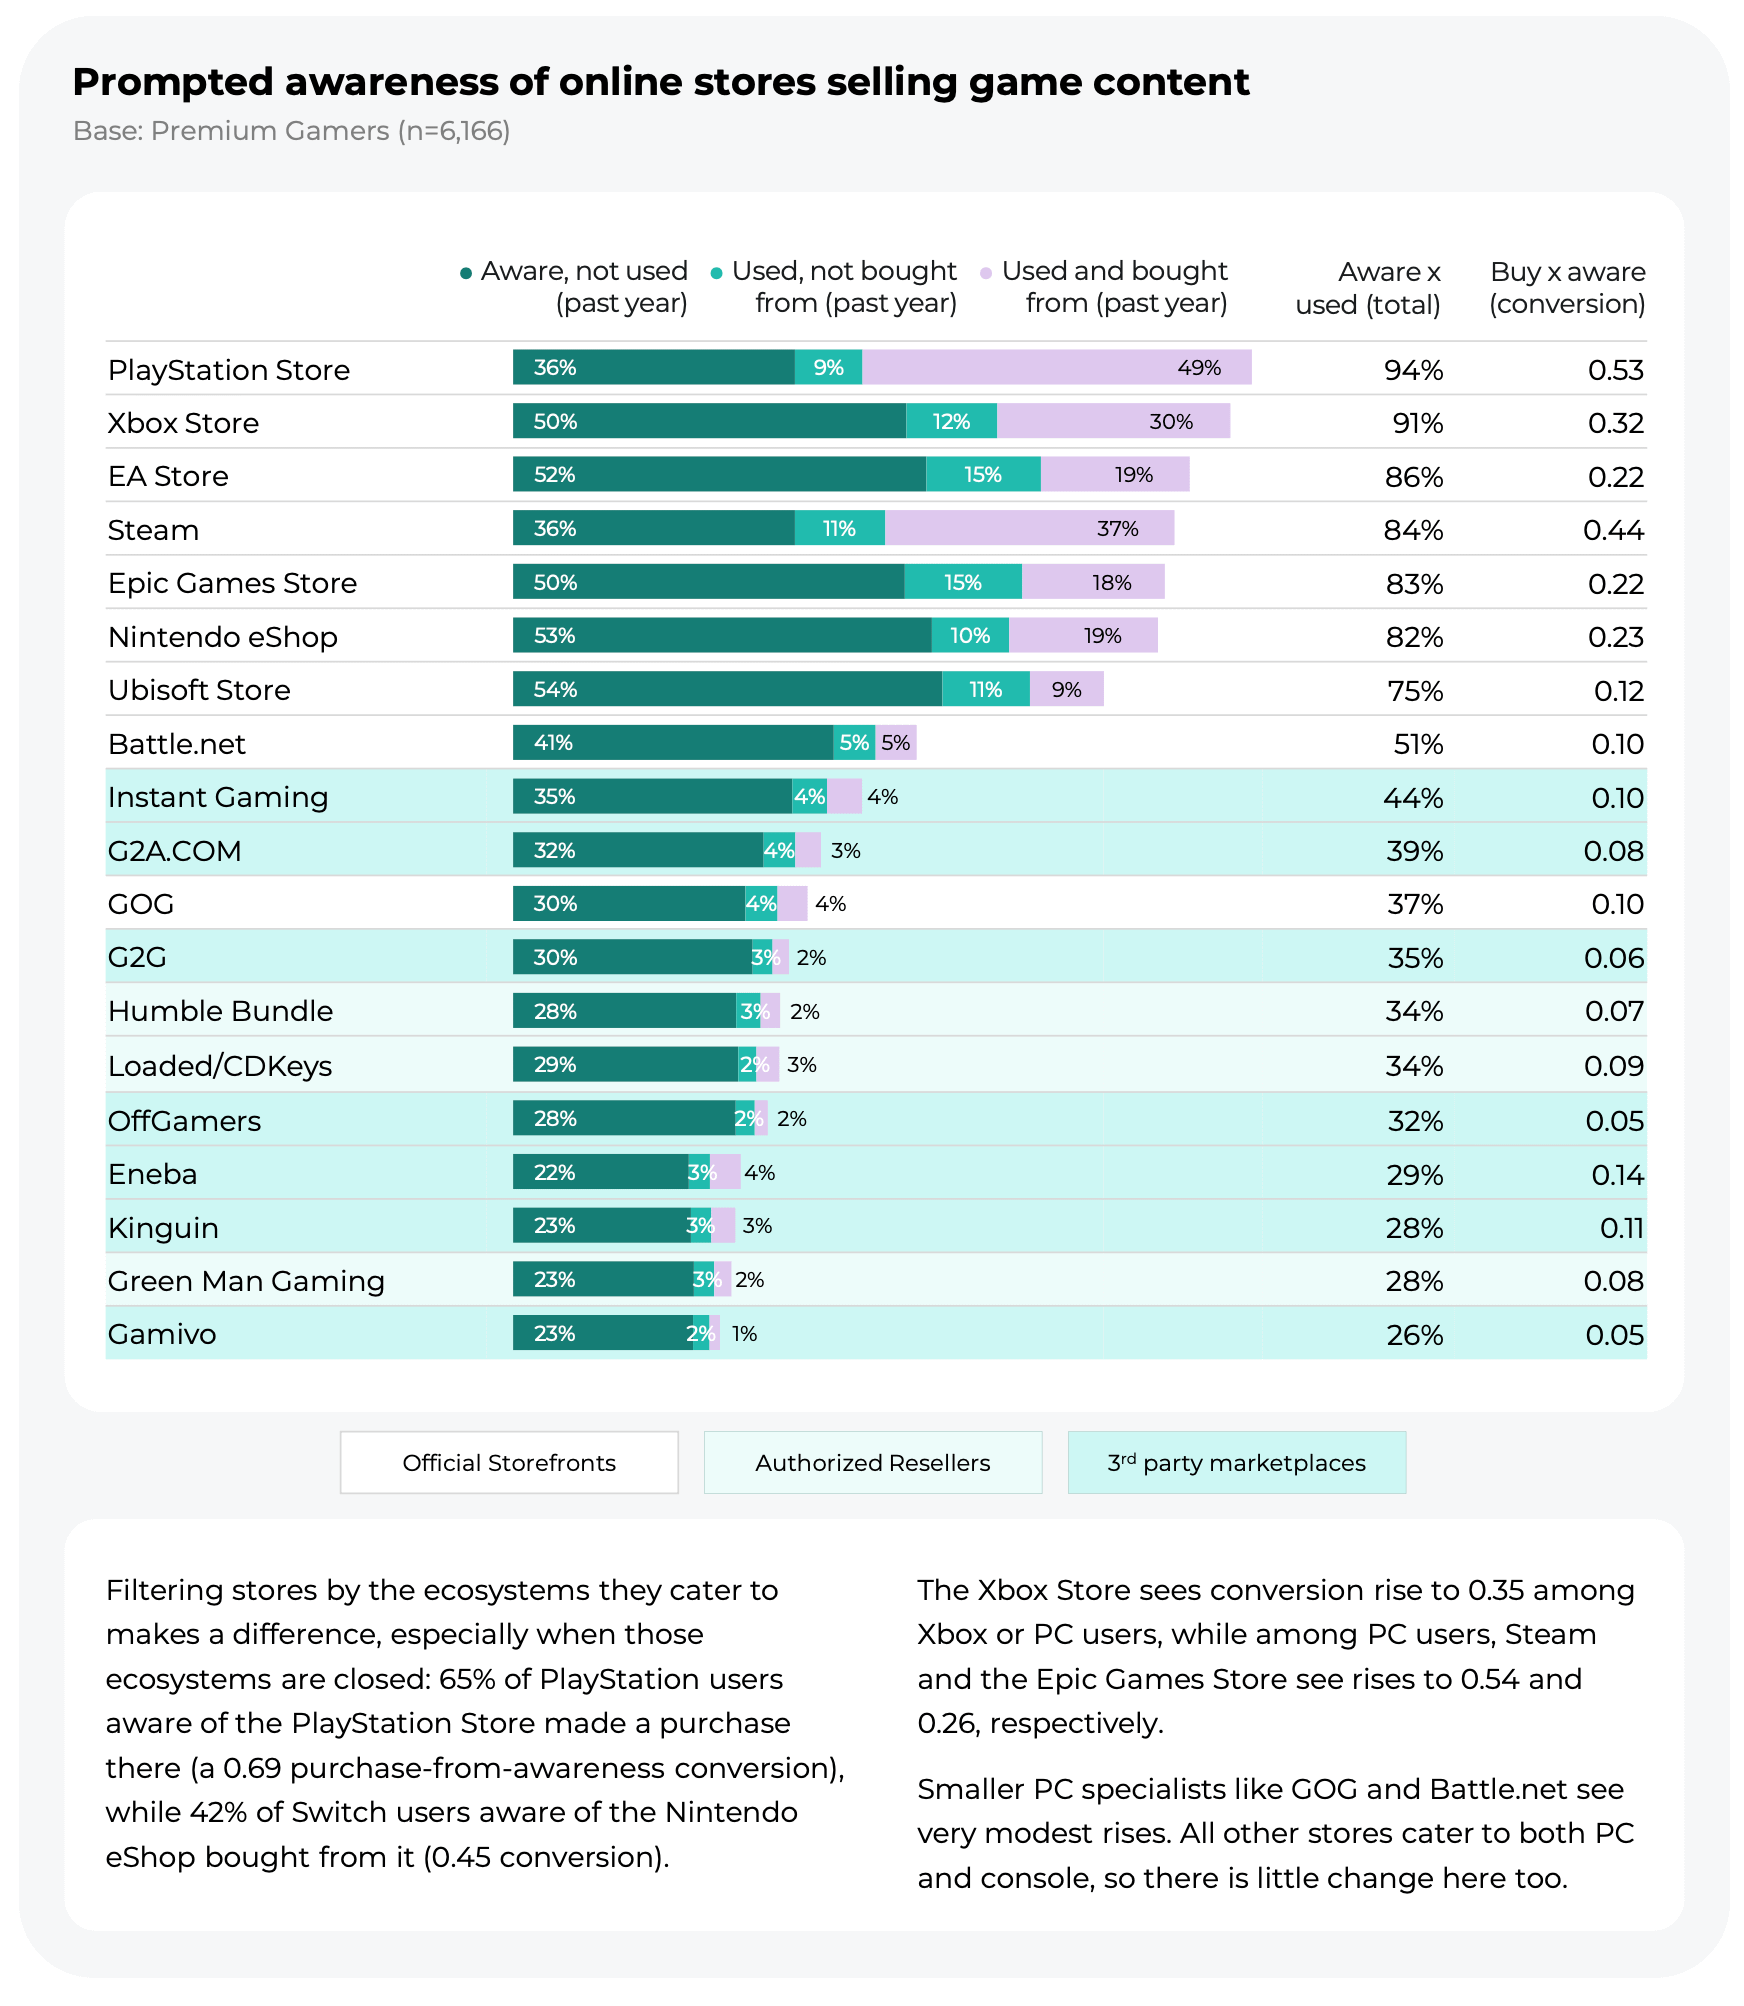
Over the past year, 49% of respondents bought something on PlayStation Store, 37% on Steam, and 30% on Xbox Store. Awareness of PlayStation Store converts into purchases best: 53% of those who know it bought something there (69% among PlayStation players).
-
Among resellers and marketplaces, Newzoo highlights Instant Gaming (44% aware, 4% bought), G2A.COM (39% aware, 3% bought), and Loaded (34% aware, 3% bought). The highest awareness-to-purchase conversion, though, belongs to Eneba (14%) and Kinguin (11%).
-
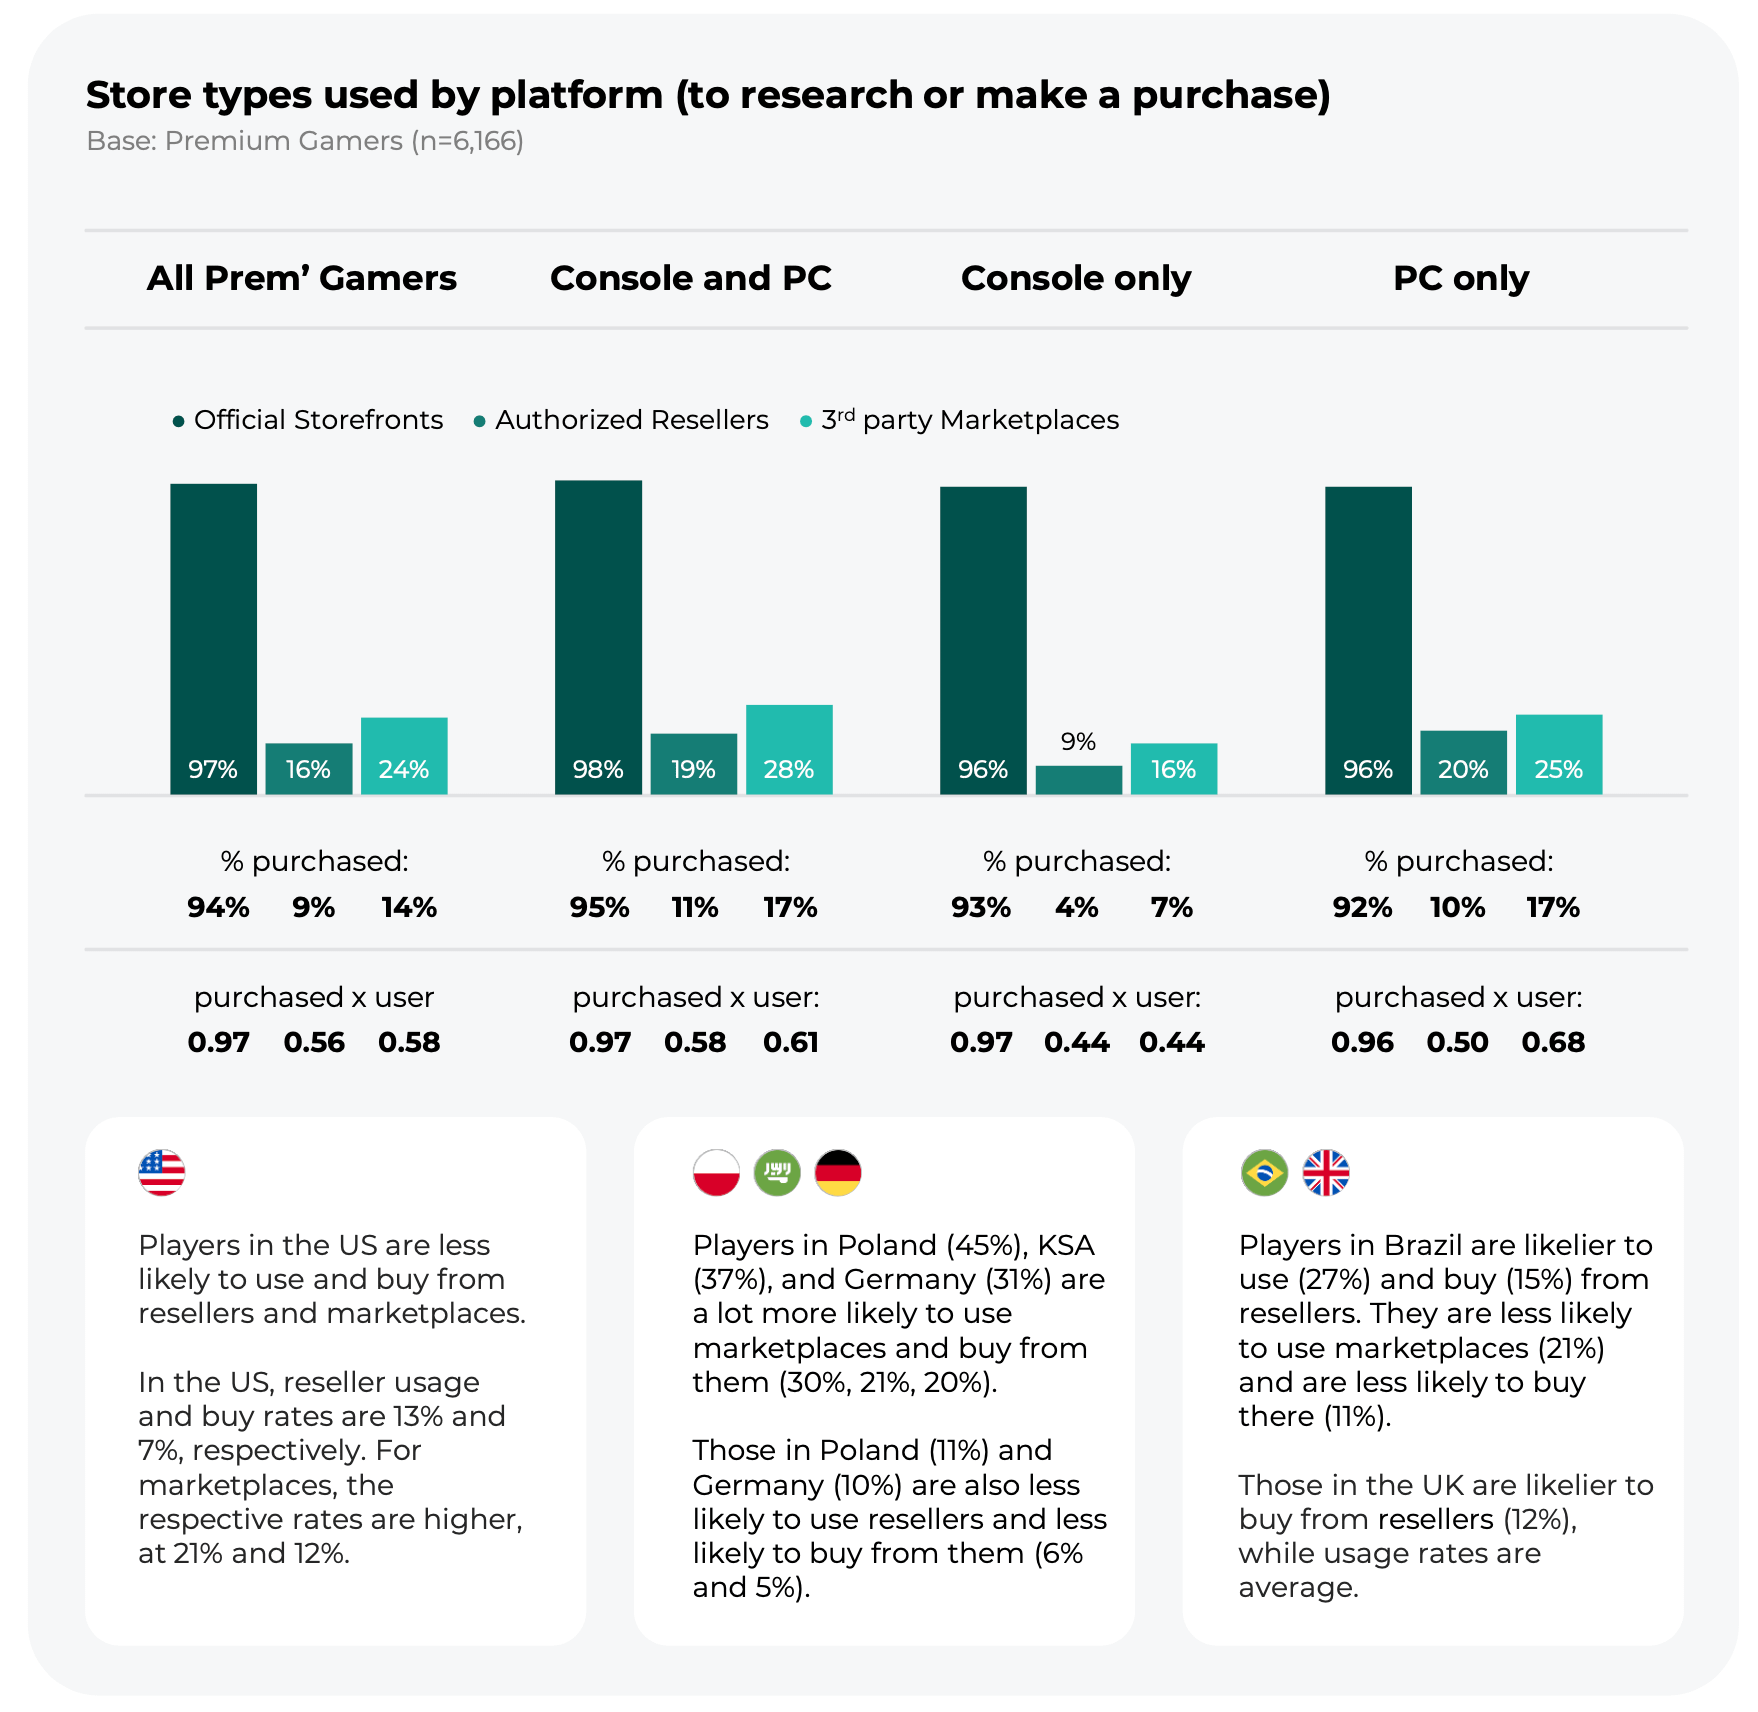
97% of respondents used official storefronts over the past year, and 94% bought something there. 24% used marketplaces (14% bought), and 16% used resellers (9% bought).
-
Among console-only players, 16% use marketplaces, and 9% use resellers. Newzoo attributes this to the closed ecosystems of PlayStation and Switch.
-
Marketplaces are used most in Poland (45%), Saudi Arabia (37%), and Germany (31%). In the US, the figure is 21%.
-
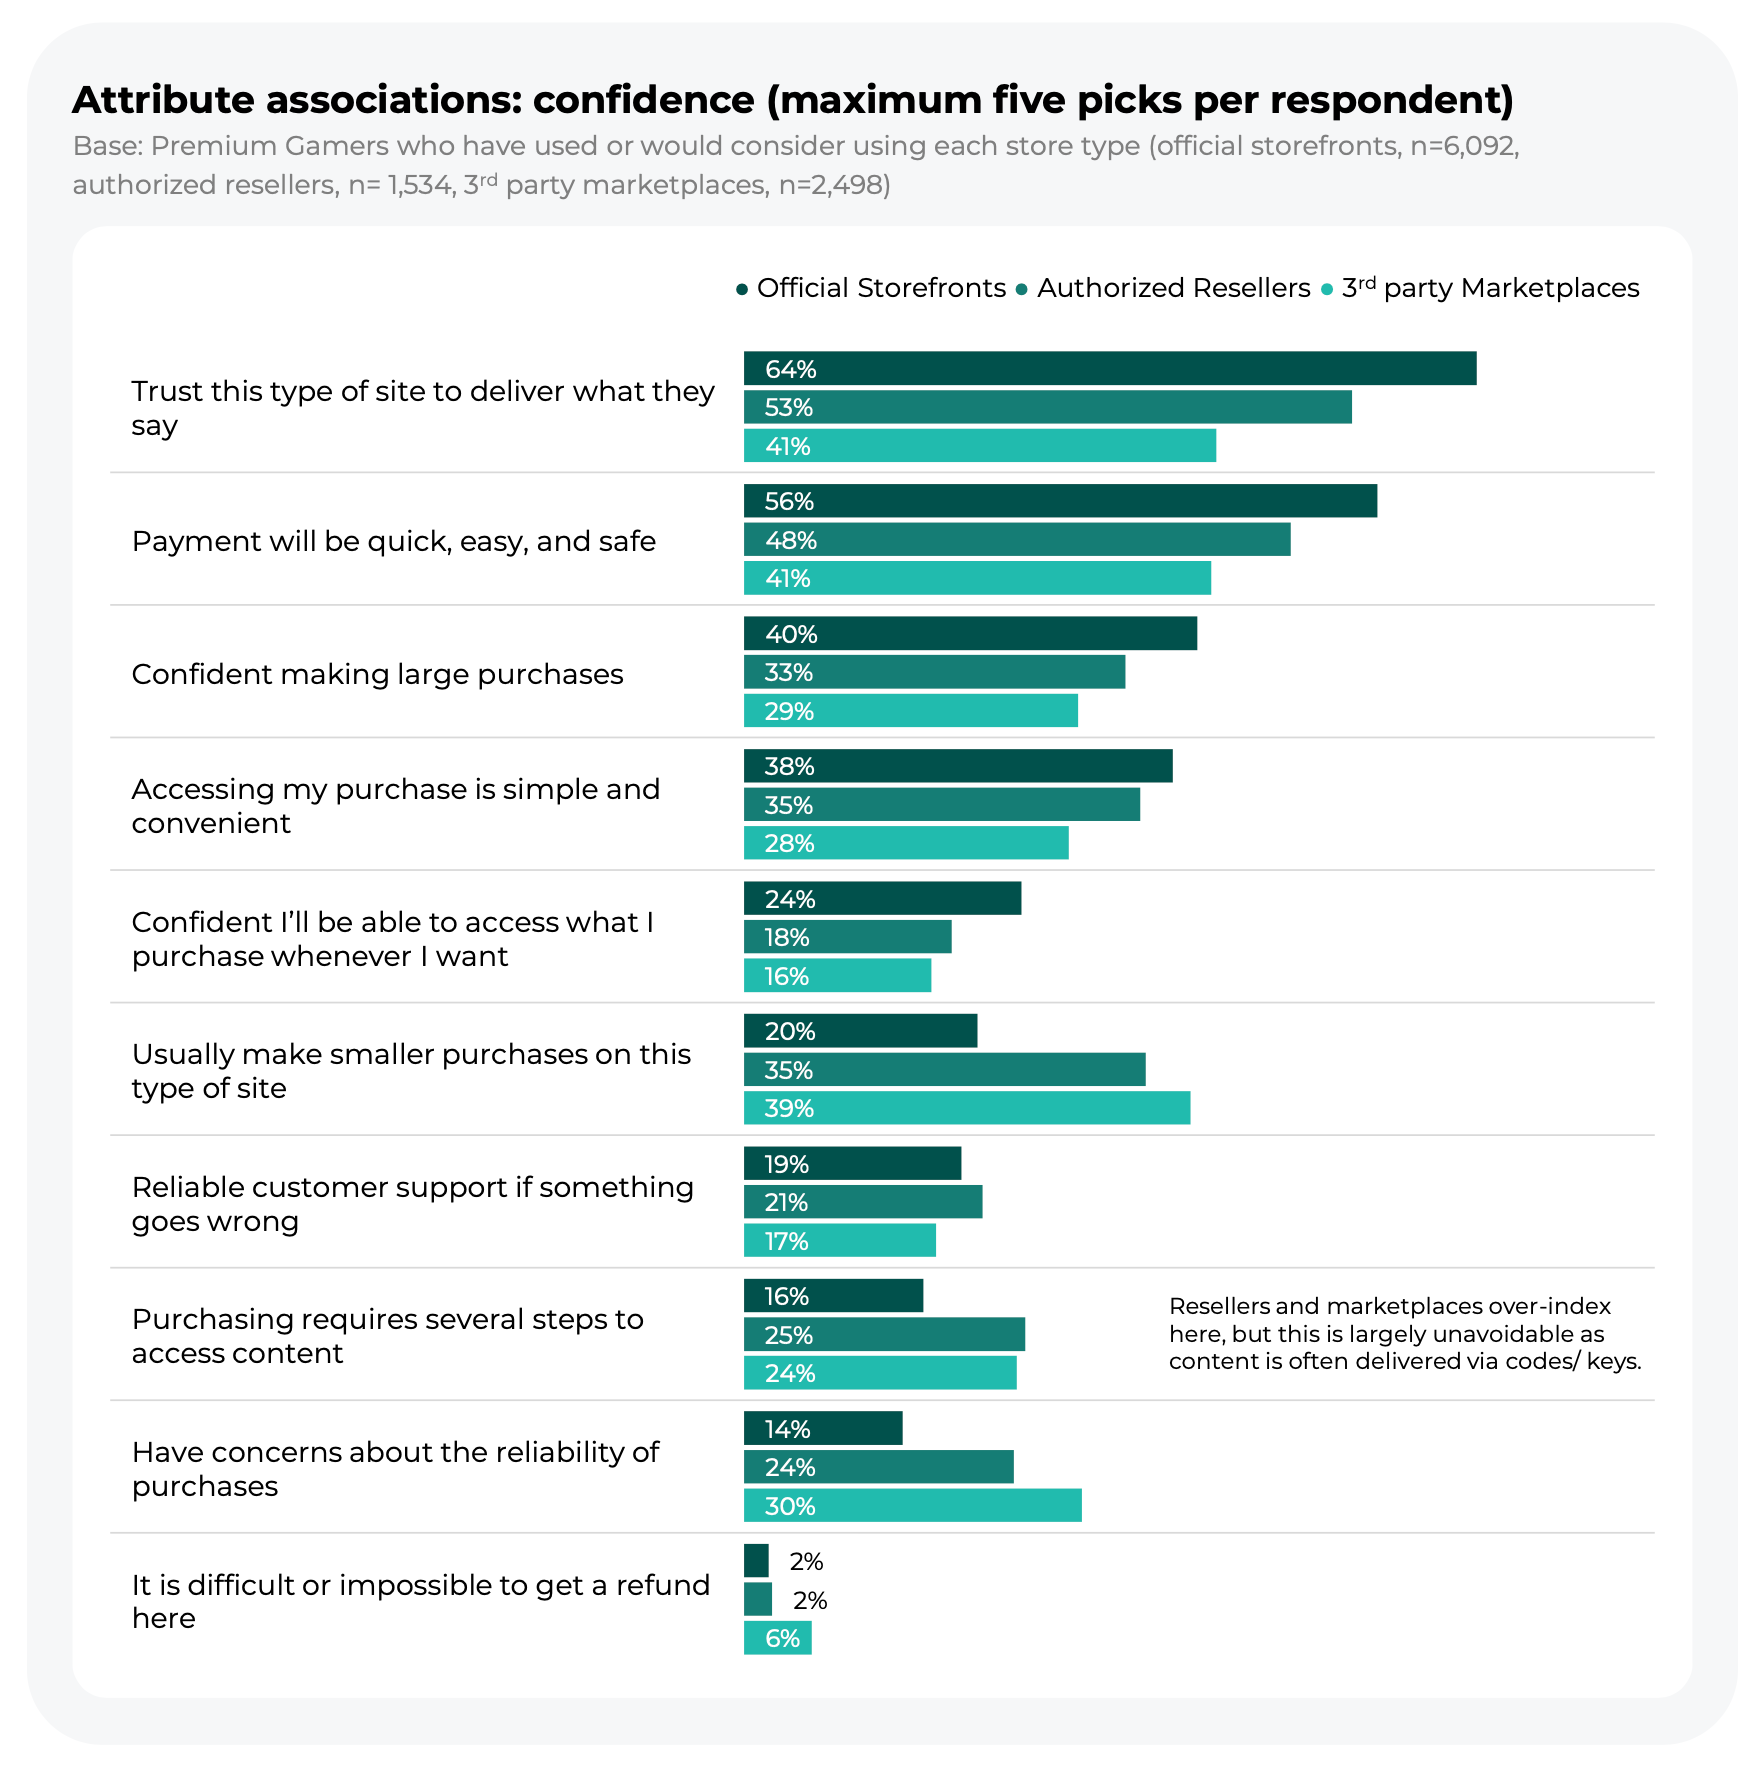
Official storefronts are trusted more: 64% are confident they’ll get what they paid for (53% for resellers, 41% for marketplaces). 30% of marketplace users doubt purchase reliability (though 14% of official storefront buyers do too).
-
Small purchases, on the other hand, are more often made on marketplaces (39%) and with resellers (35%) than in official storefronts (20%).
-
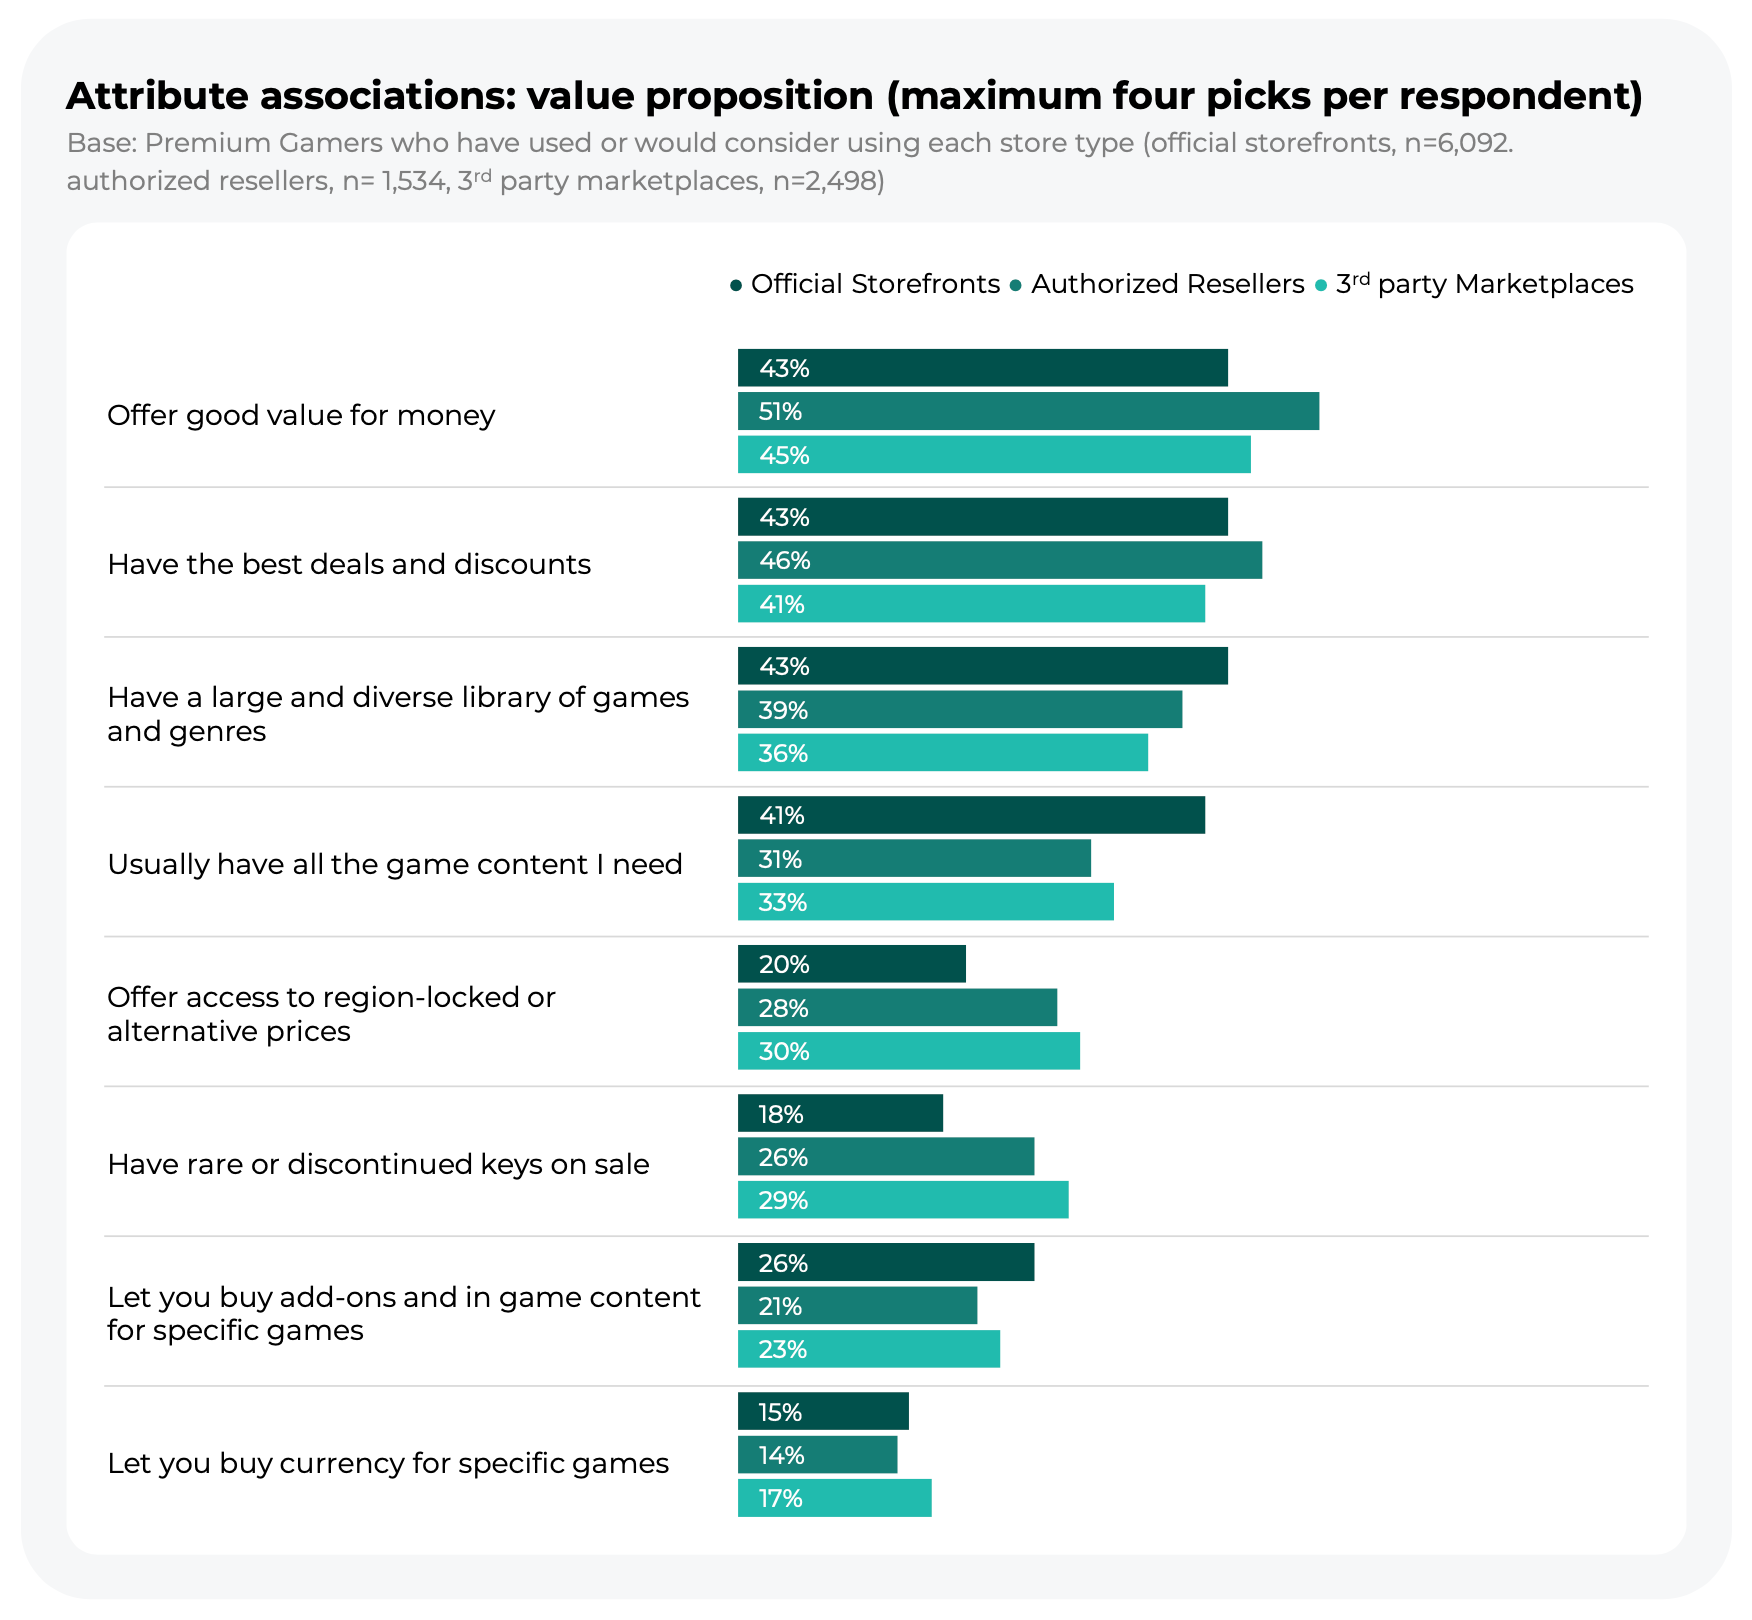
On value for money, resellers lead (51%), marketplaces are second (45%), and official storefronts follow (43%). Marketplaces are more often associated with access to regional prices (30%) and rare keys (29%), while official storefronts are associated with a large library (43%).
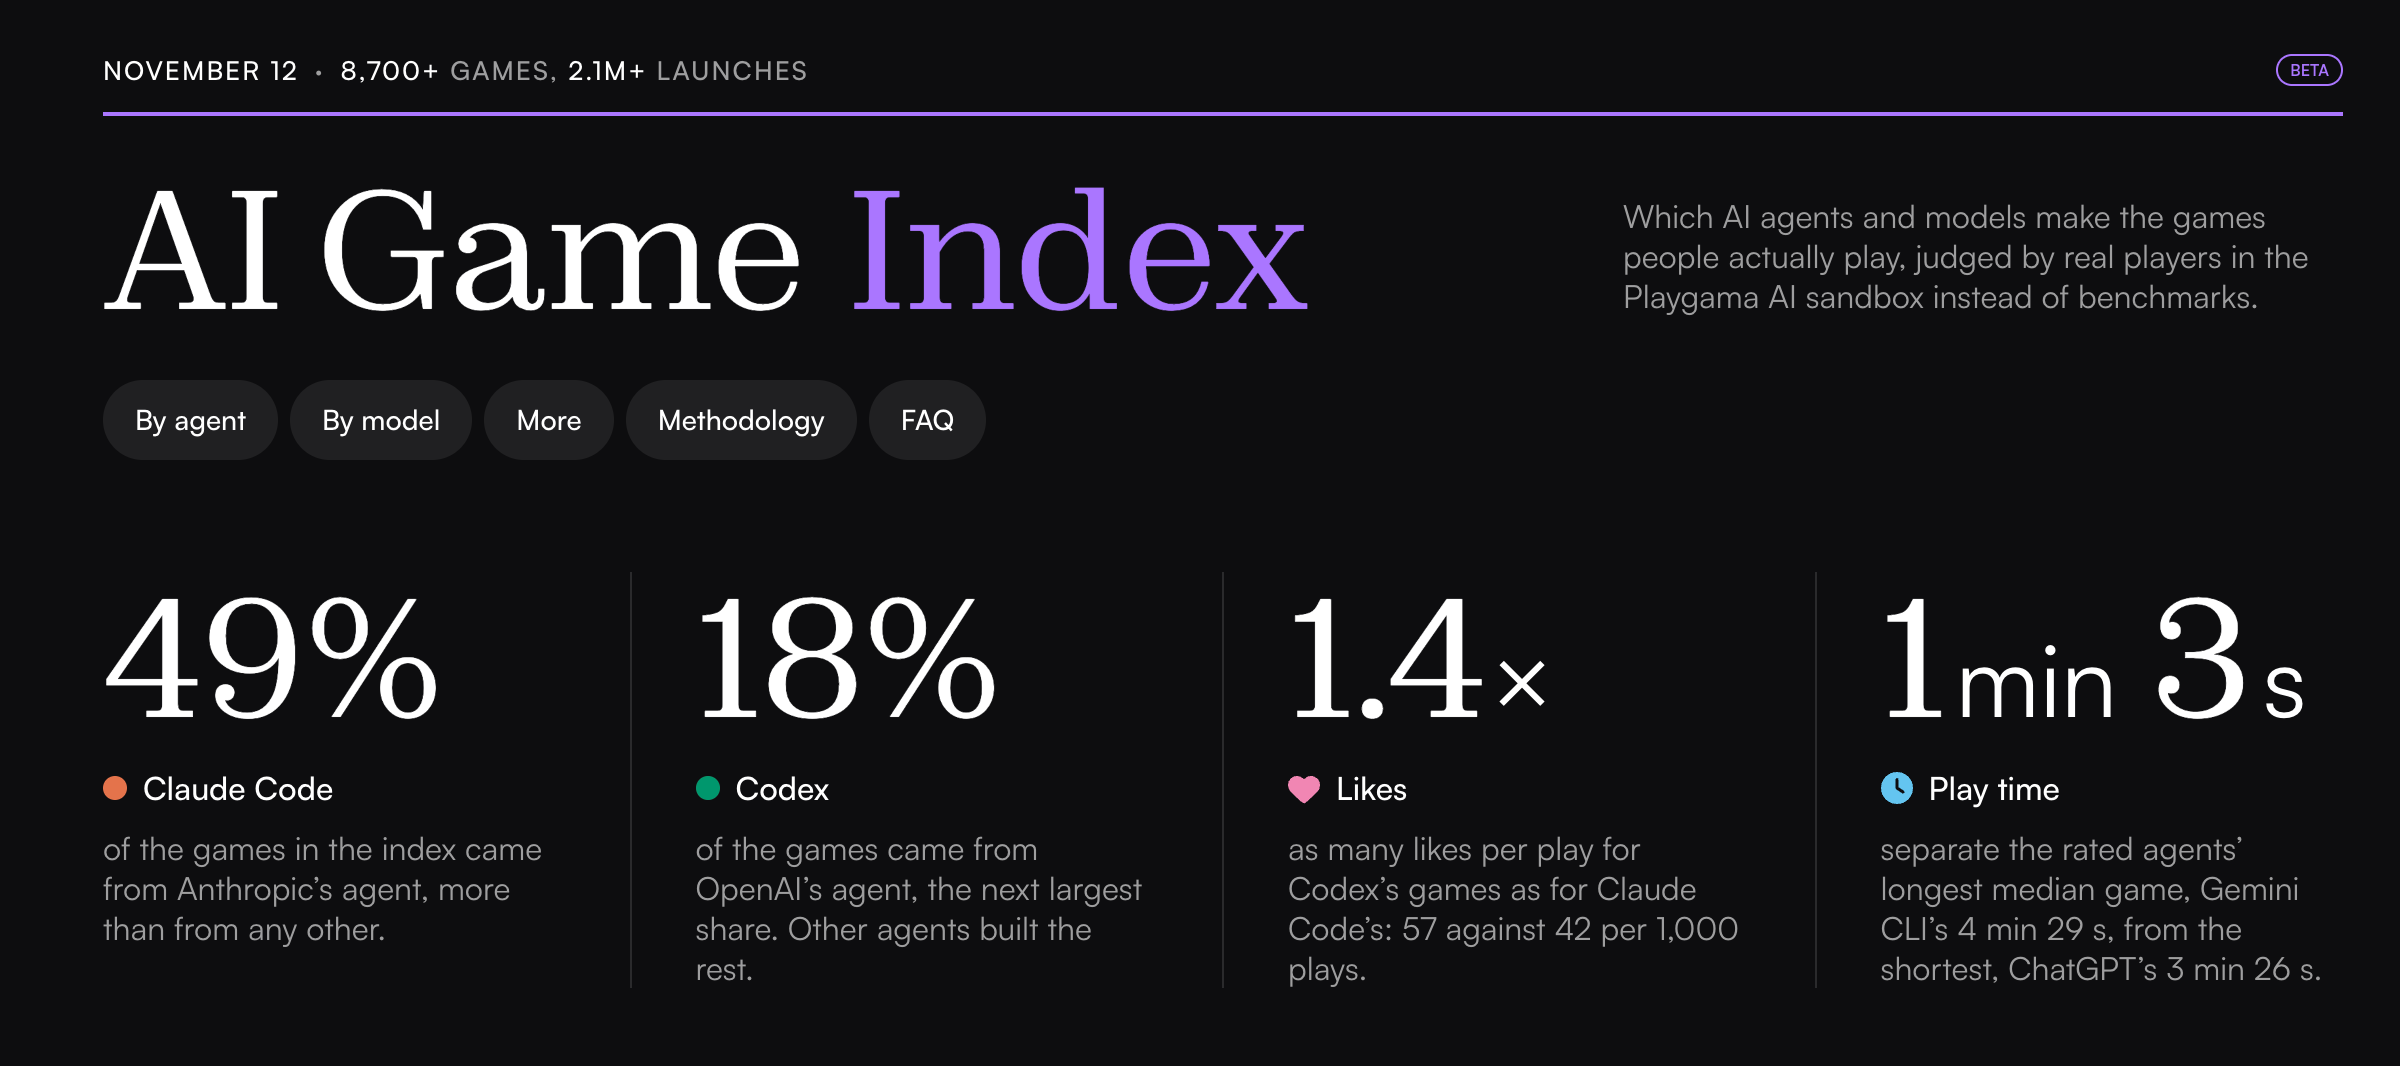
The AI Game Index ranks AI agents and models by evaluating how people play AI-made web games. The index covers 8,719 games published via Playgama AI (manually or via Playgama MCP straight from the agent) and 2.17 million launches.
Data as of November 12, 2026.
Developers name the agent and model themselves when publishing; Playgama doesn’t verify this data. Play time and likes per 1,000 plays are calculated for the median game.
A game enters the ranking after 20 launches by live players, and an agent or model after 15 such projects.
-
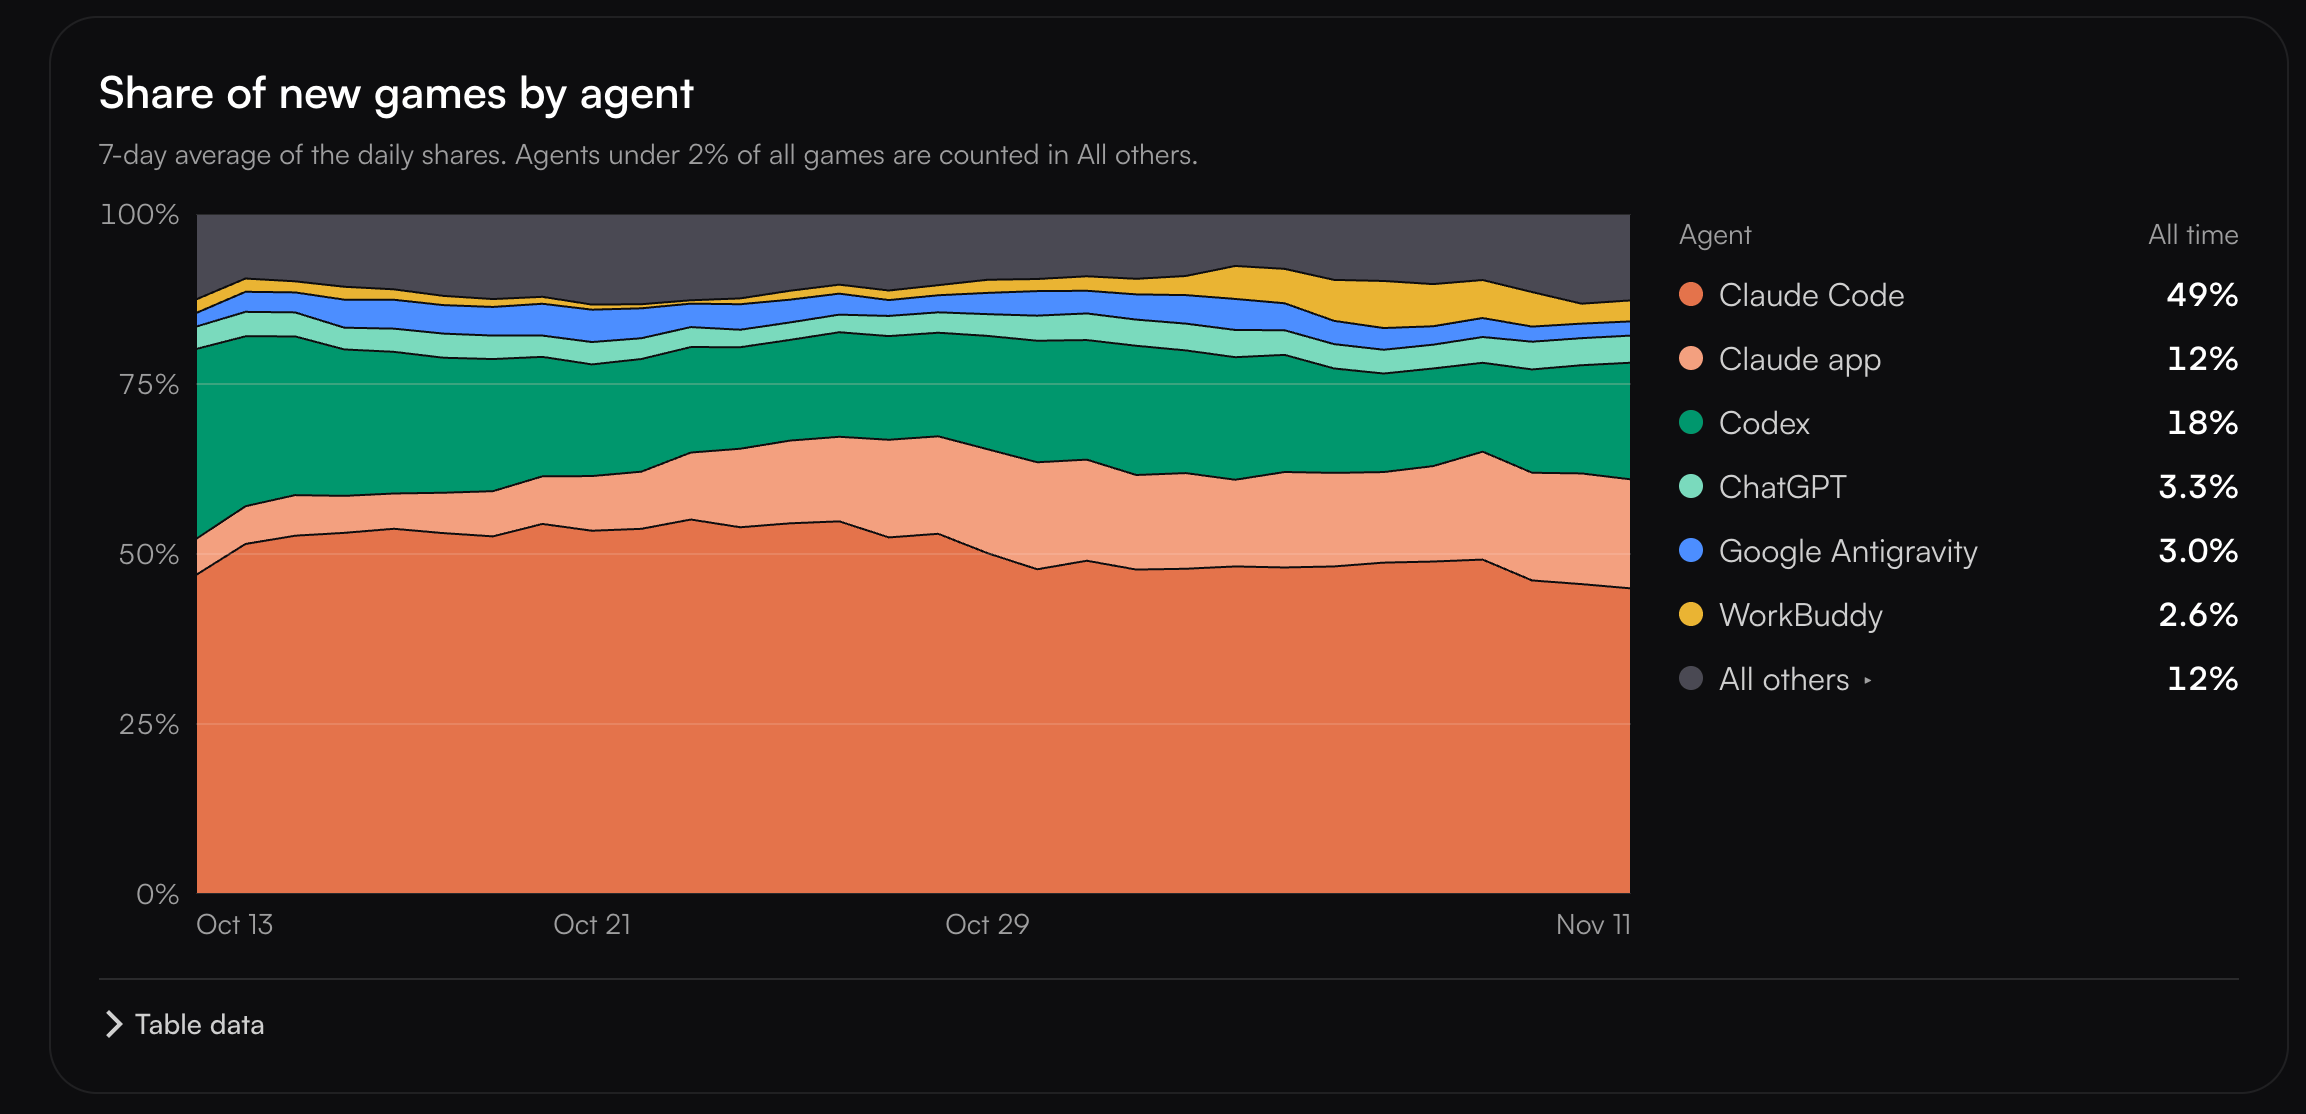
Claude Code made almost half of the games in the index (49%). Codex by OpenAI is second (18%), and the Claude app for web and desktop is third (12%). Together, Anthropic’s tools account for 61% of all games.
A word from our sponsor

The right artist for your game rarely lives down the street. Mellow takes distance out of the equation: contracts with IP and NDA clauses, cross-border compliance, and payments, all in one flow. Hire for talent, not for location.
-
However, the share of new games made with Claude Code declined over the last month. Codex is also losing a bit. Games made with the Claude app, on the other hand, are gaining popularity.
-
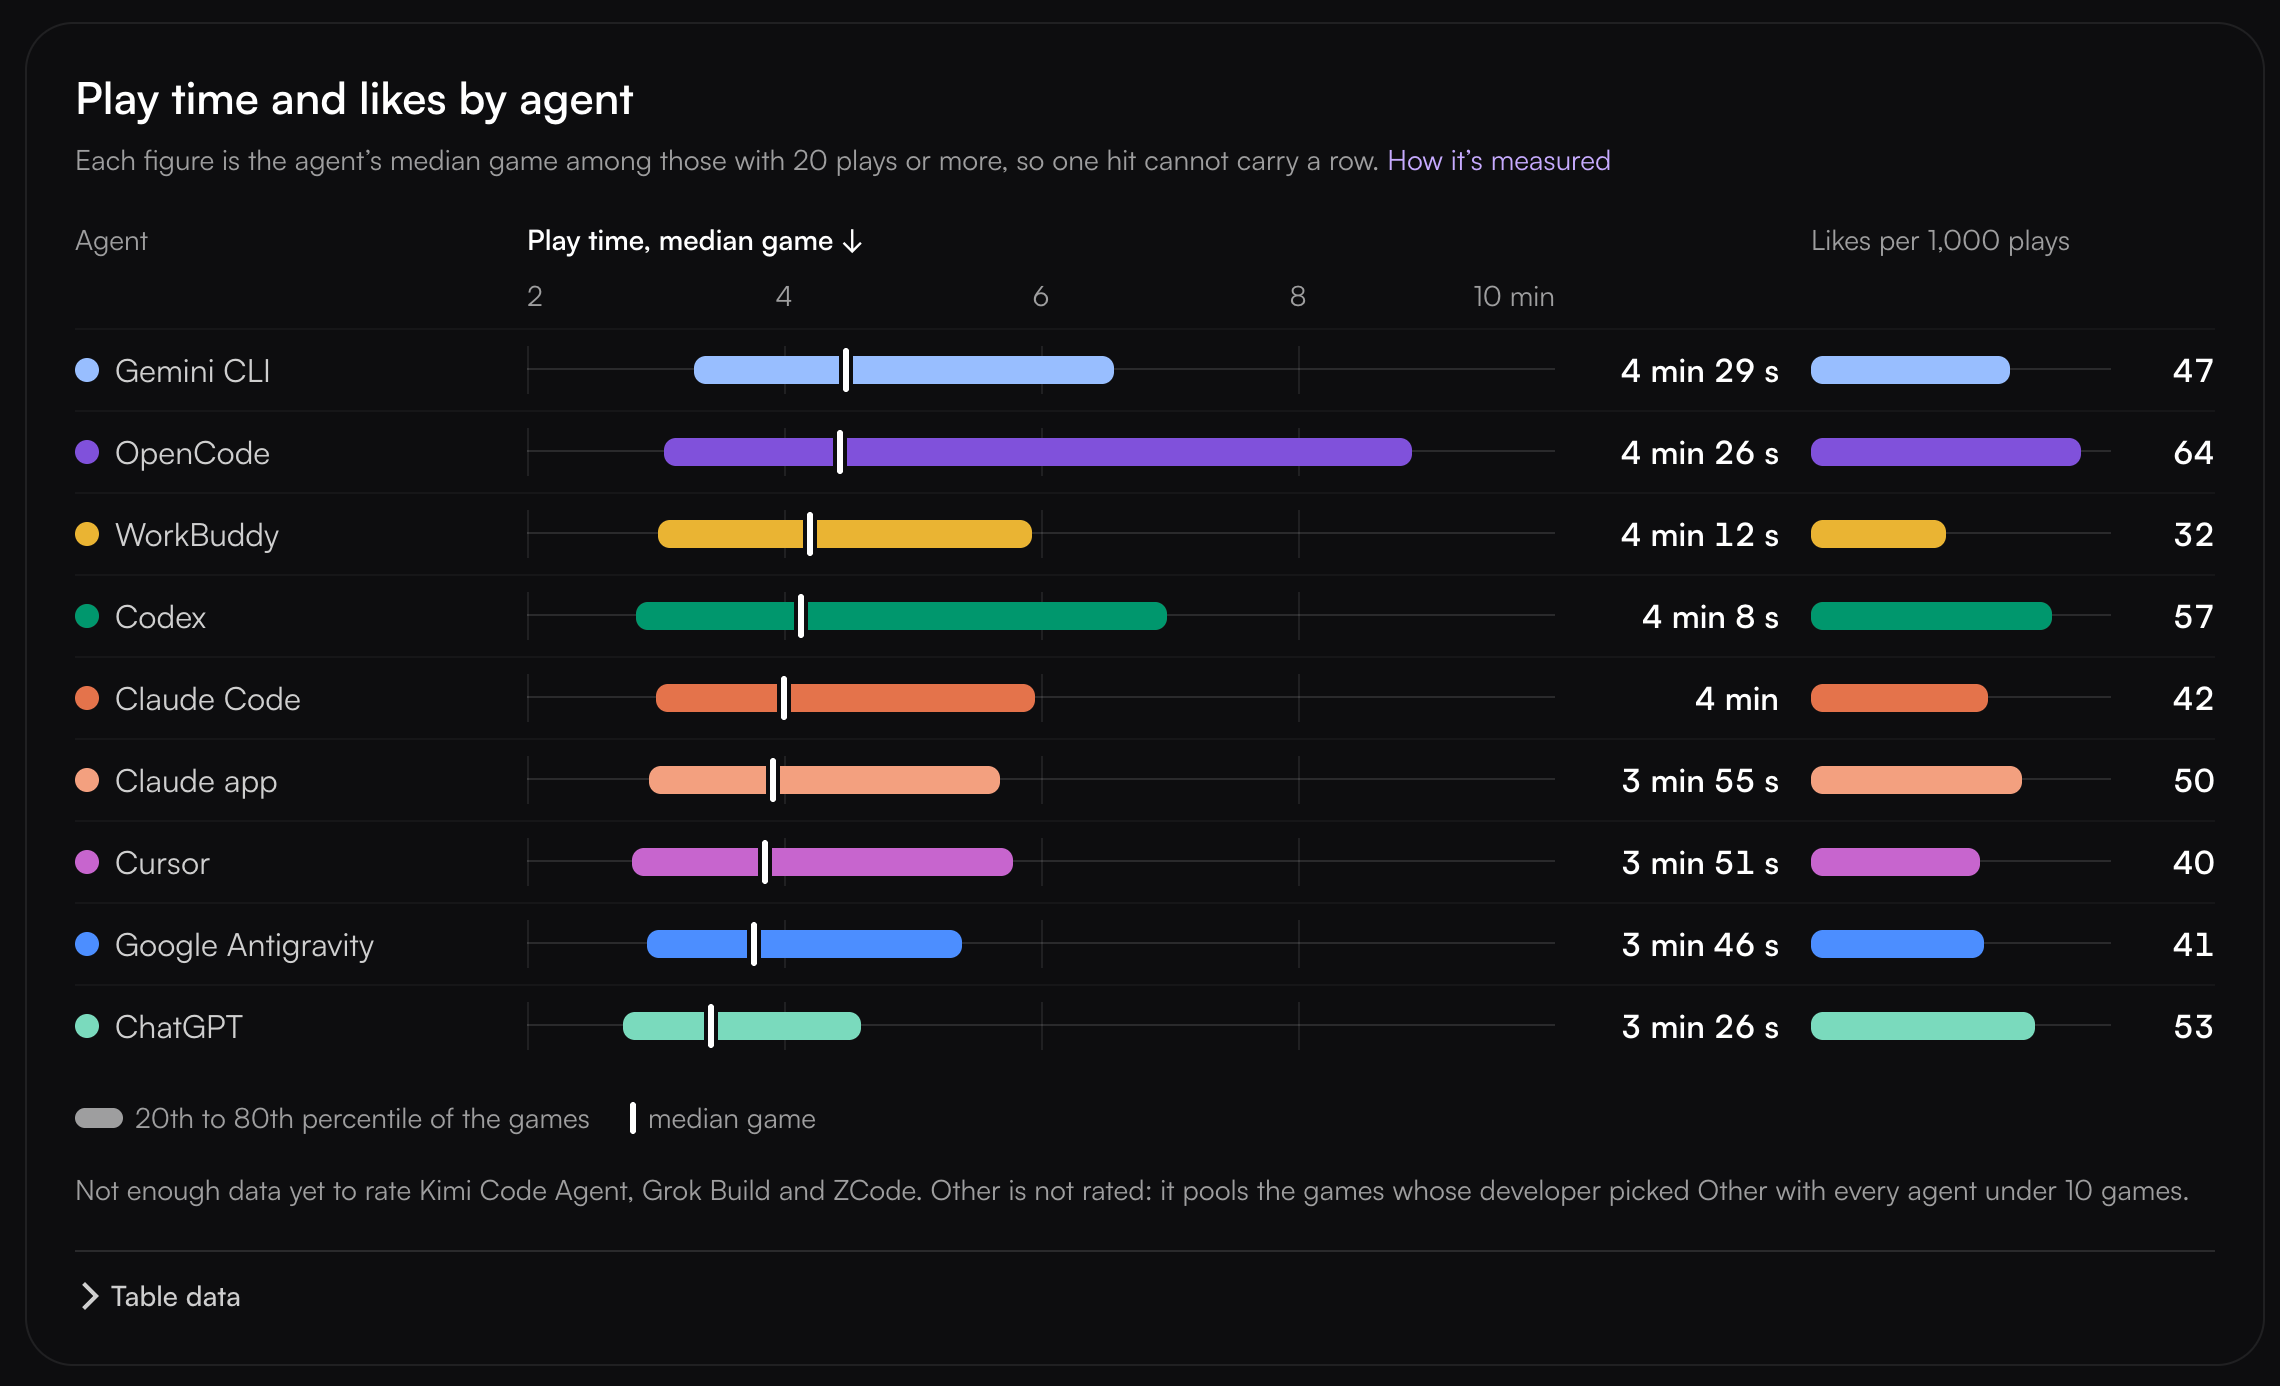
People play games made with Gemini CLI the longest: 4 minutes 29 seconds for the median game. ChatGPT games are played the least (3 minutes 26 seconds).
-
By likes, OpenCode leads (64 per 1,000 plays). Games made with WorkBuddy get the fewest likes (32).
❗️The leaders in play time and likes have very small samples: Gemini CLI accounts for 0.5% of games in the index, and OpenCode for 1.2%.
-
Claude Code and Codex have almost identical play time: 4 minutes and 4 minutes 8 seconds. However, people like games made with Codex 1.4 times more often: 57 vs. 42 likes per 1,000 plays.
-
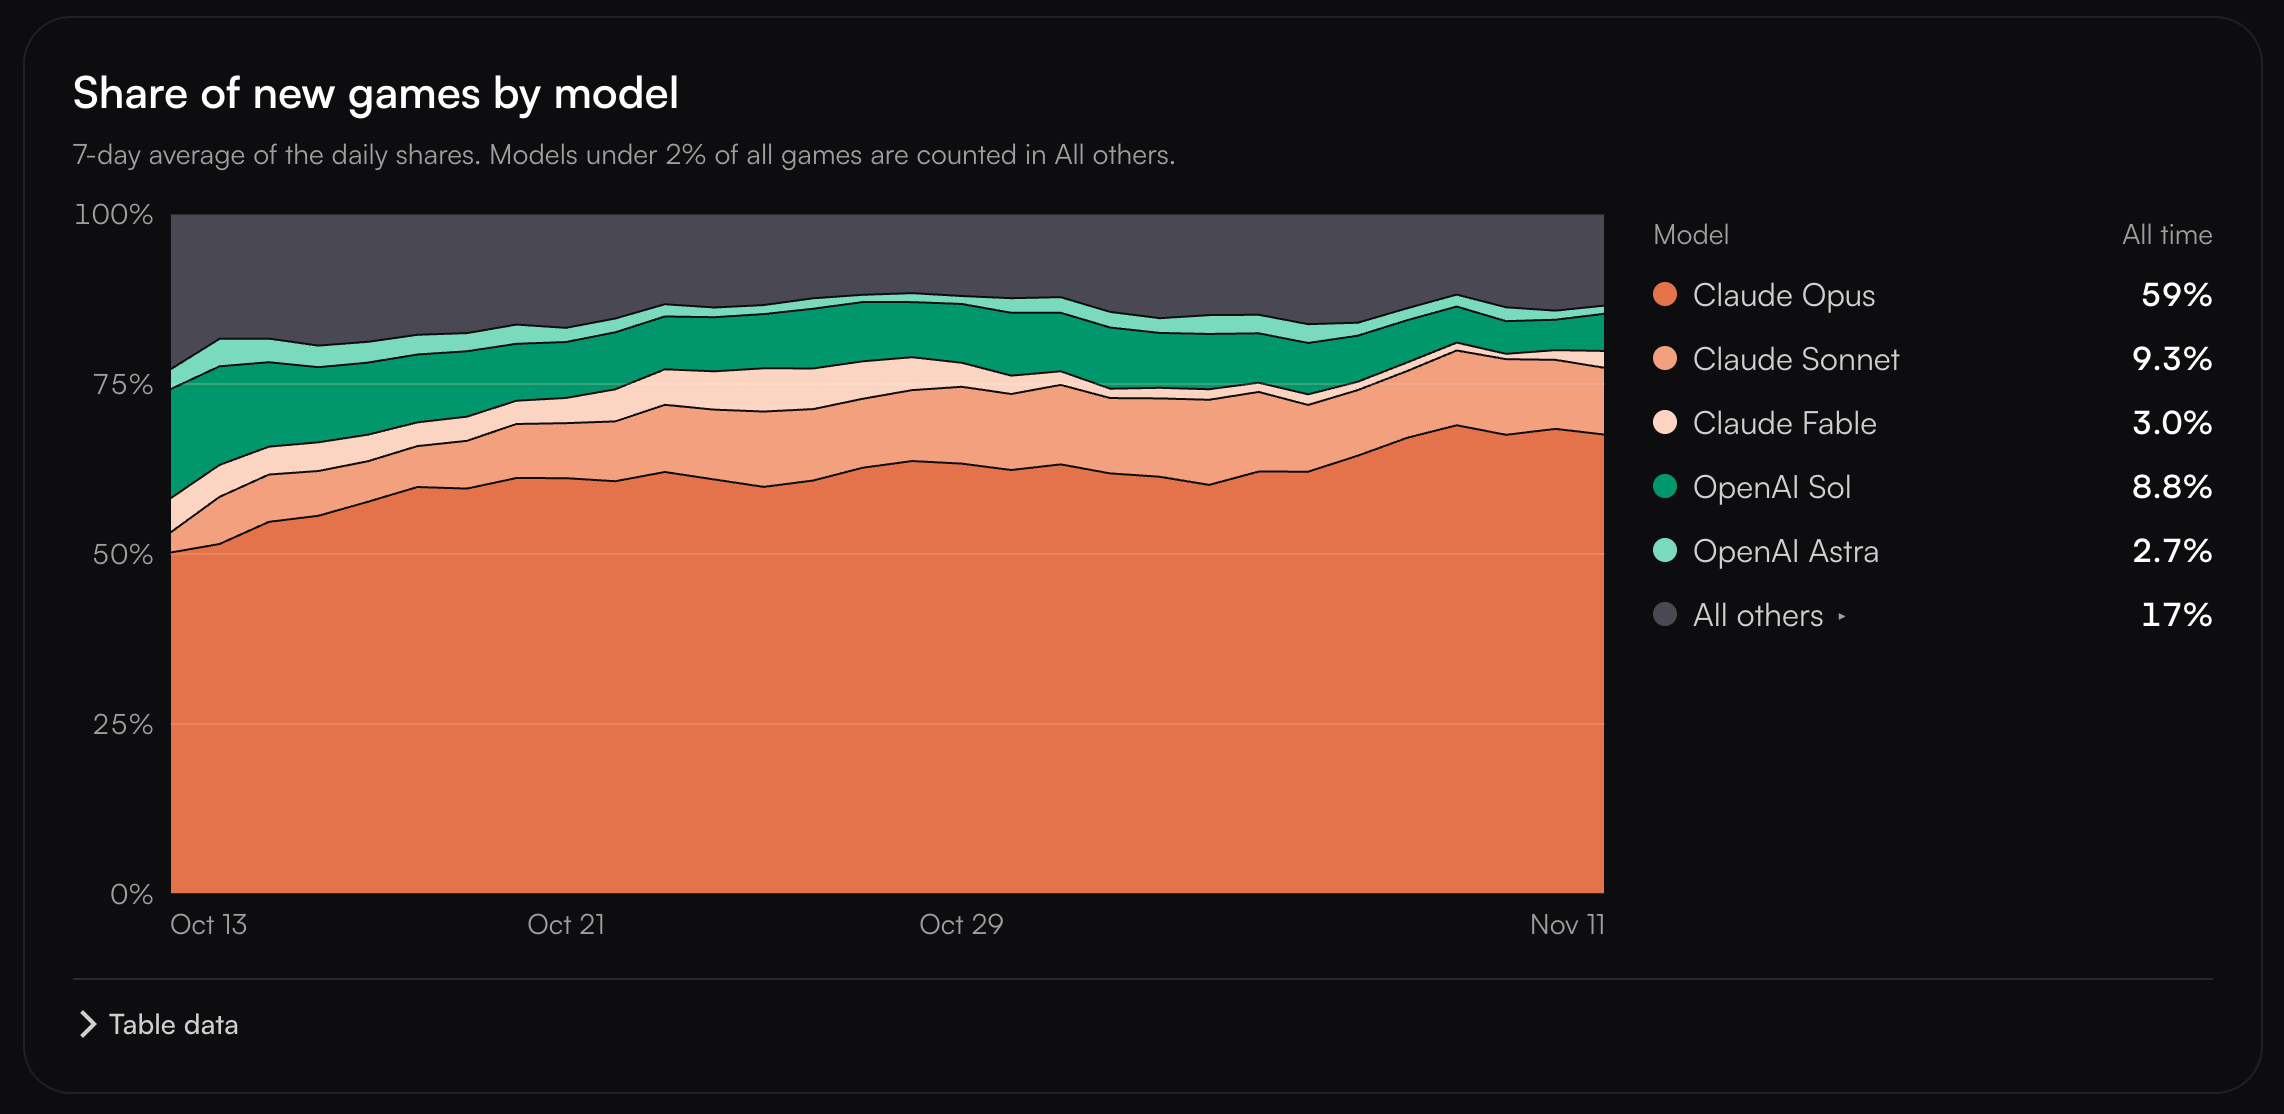
Claude Opus leads among models by a wide margin, with 59% of all games created. Claude Sonnet (9.3%) and OpenAI Sol (8.8%) follow. Together with Claude Fable, Anthropic’s models account for over 70% of games.
-
Over the last month, Claude Opus’s share of new games grew, while OpenAI Sol’s declined noticeably.
-
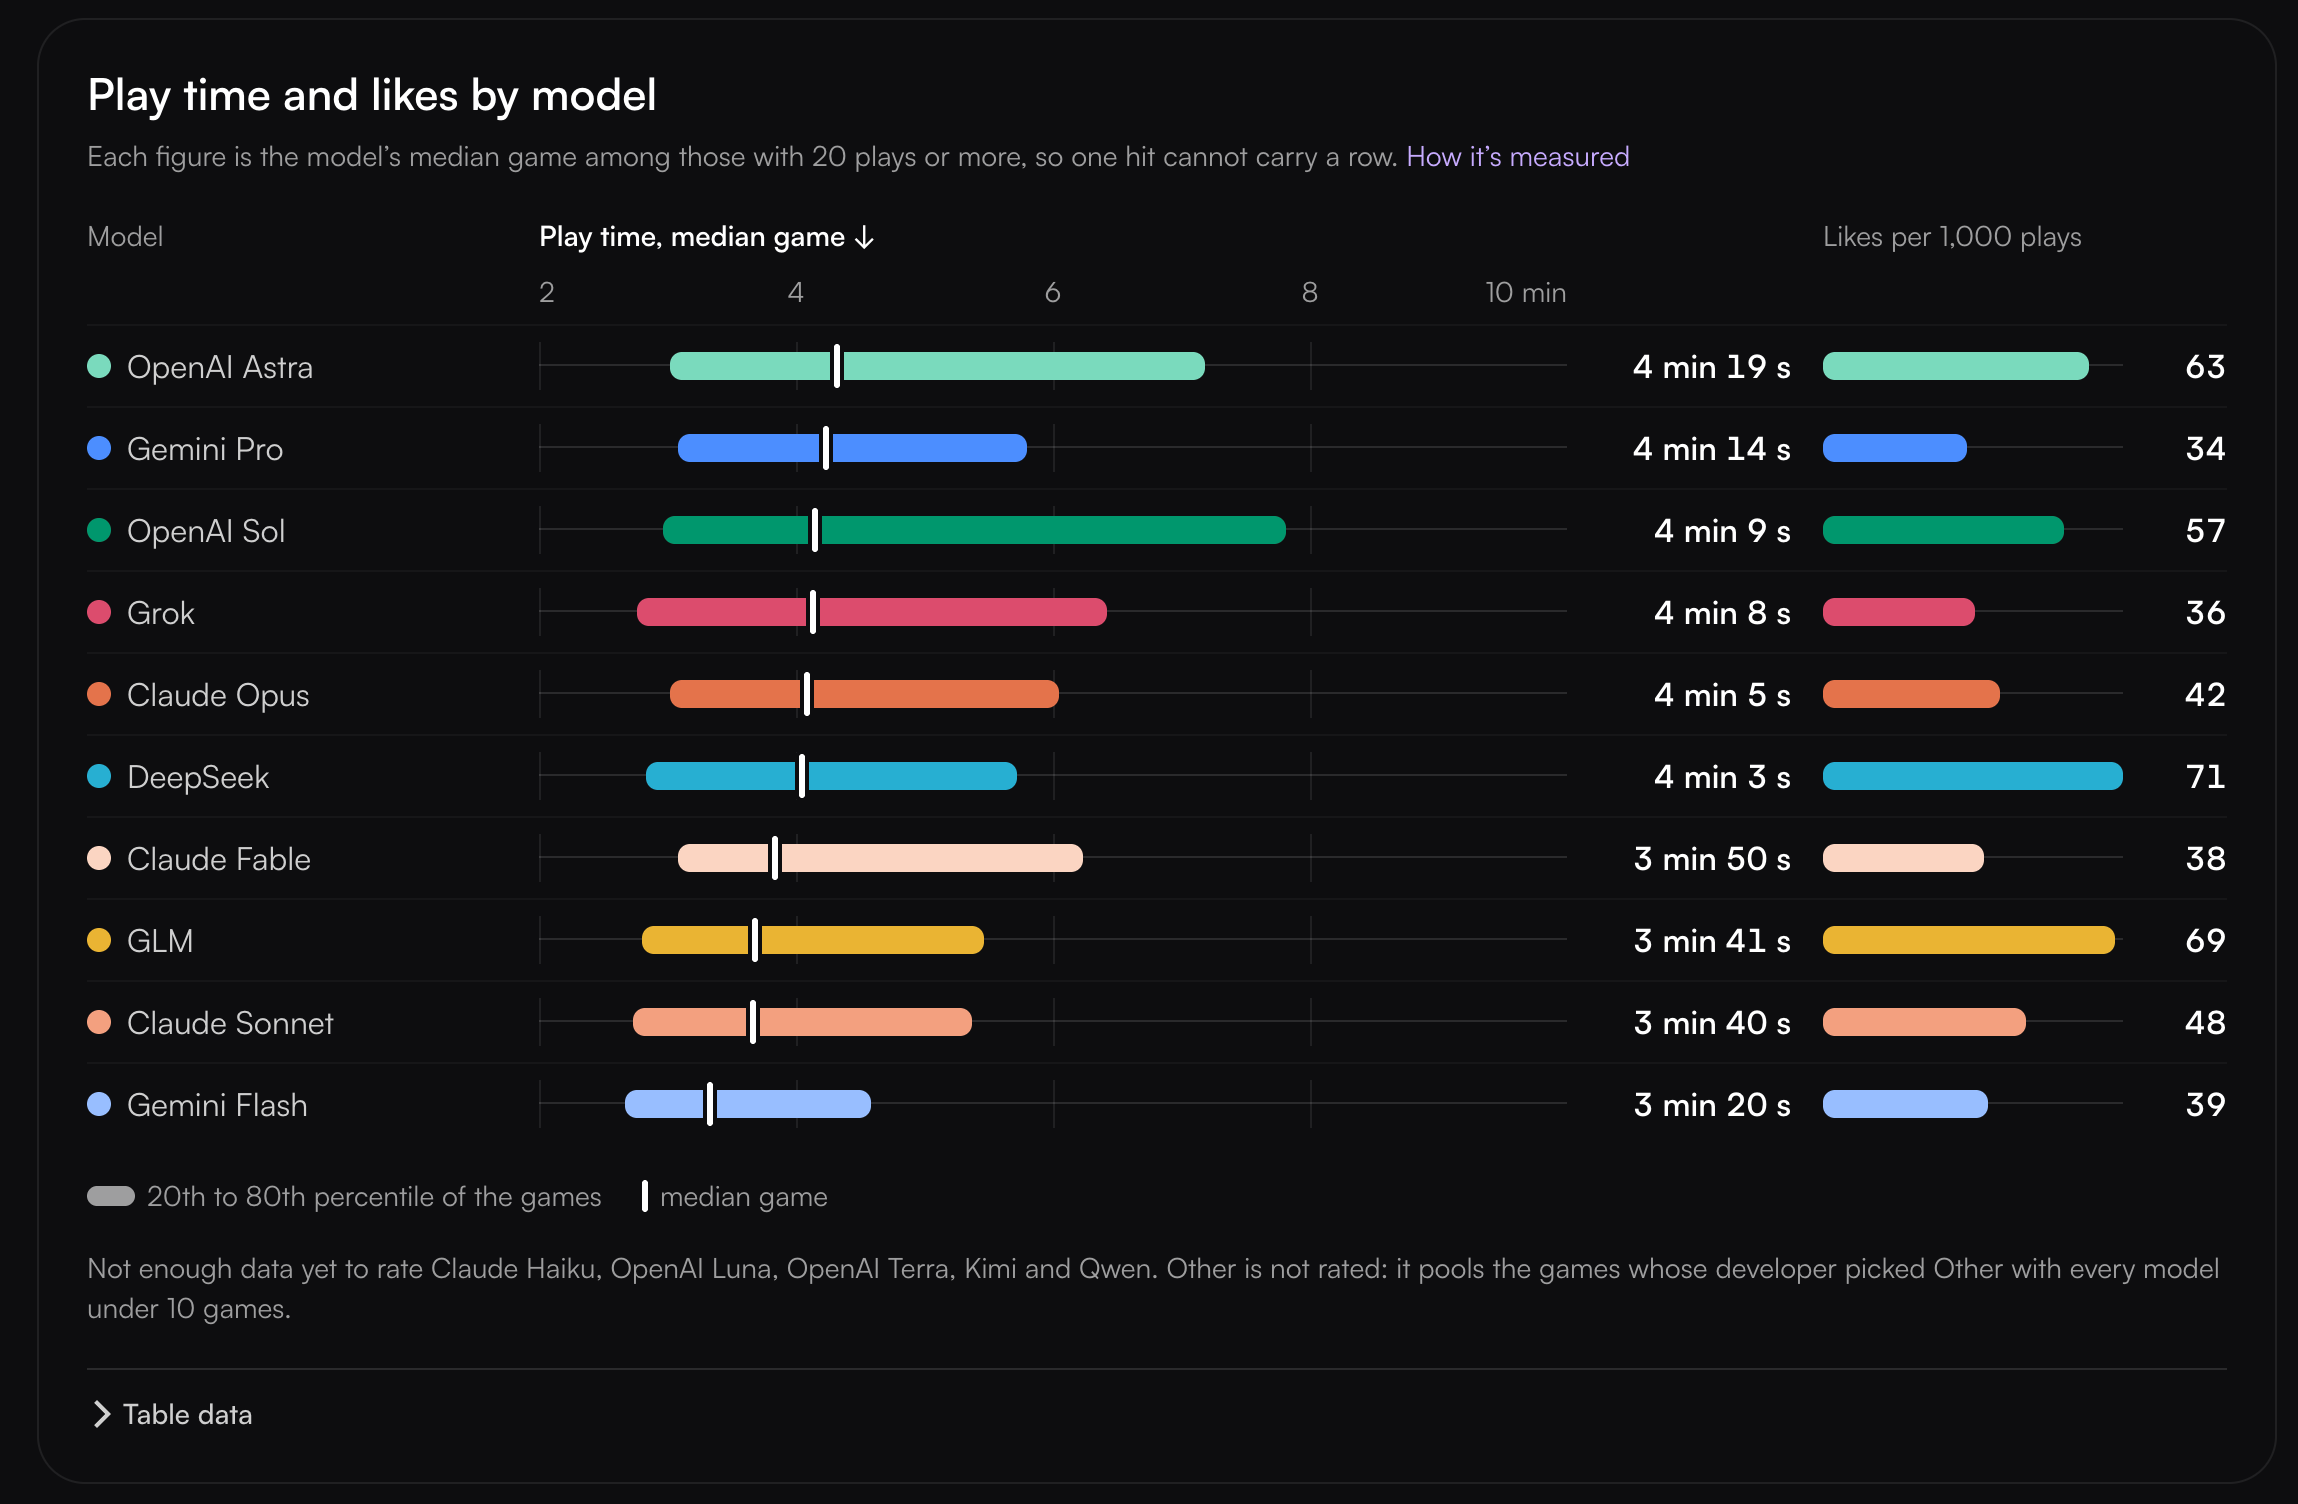
How long people play games made with these models barely differs: from 3 minutes 20 seconds for Gemini Flash to 4 minutes 19 seconds for OpenAI Astra. Claude Opus has 4 minutes 5 seconds, and OpenAI Sol has 4 minutes 9 seconds.
-
By likes, DeepSeek leads (71 per 1,000 plays), followed by GLM (69) and OpenAI Astra (63). OpenAI Sol has 57, and Claude Opus has 42.
Xsolla analyzed data from 756 mobile game web shops for January-June 2026. The report’s market numbers come from Sensor Tower, Moloco, and public company filings.
-
After Apple made ad tracking opt-in in April 2021, the cost per install for midcore games on iOS rose 78% by 2024: from $2.71 to $4.83, according to Moloco and Z2A Digital.
-
According to Sensor Tower, mobile games’ IAP revenue grew only 0.2% in 2025. And in September 2025, non-gaming apps out-earned games on in-app purchases for the first time.
❗️In its January State of Mobile report, Sensor Tower estimated mobile games’ IAP revenue growth in 2025 at 1.3% (to $81.75 billion).
-
At the same time, mobile games’ revenue through direct and alternative payments in North and South America grew 26% in 2025. For the top 100 games, growth was even higher: 38%. These are also Sensor Tower estimates.
If a contractor drew it, the answer depends on the contract — and without one, it might not be you. Mellow contracts cover IP rights and NDAs from day one, so every asset belongs to your studio and your project stays confidential. Payments and compliance run in the same flow.
-
Public companies increasingly disclose their D2C share in their earnings. Stillfront earns 39% of its revenue directly, and Playtika 27%, with a target of 40%.
Xsolla measures web shop performance through capture rate: the web shop’s share of all player spend on a game (app stores and the web shop combined).
-
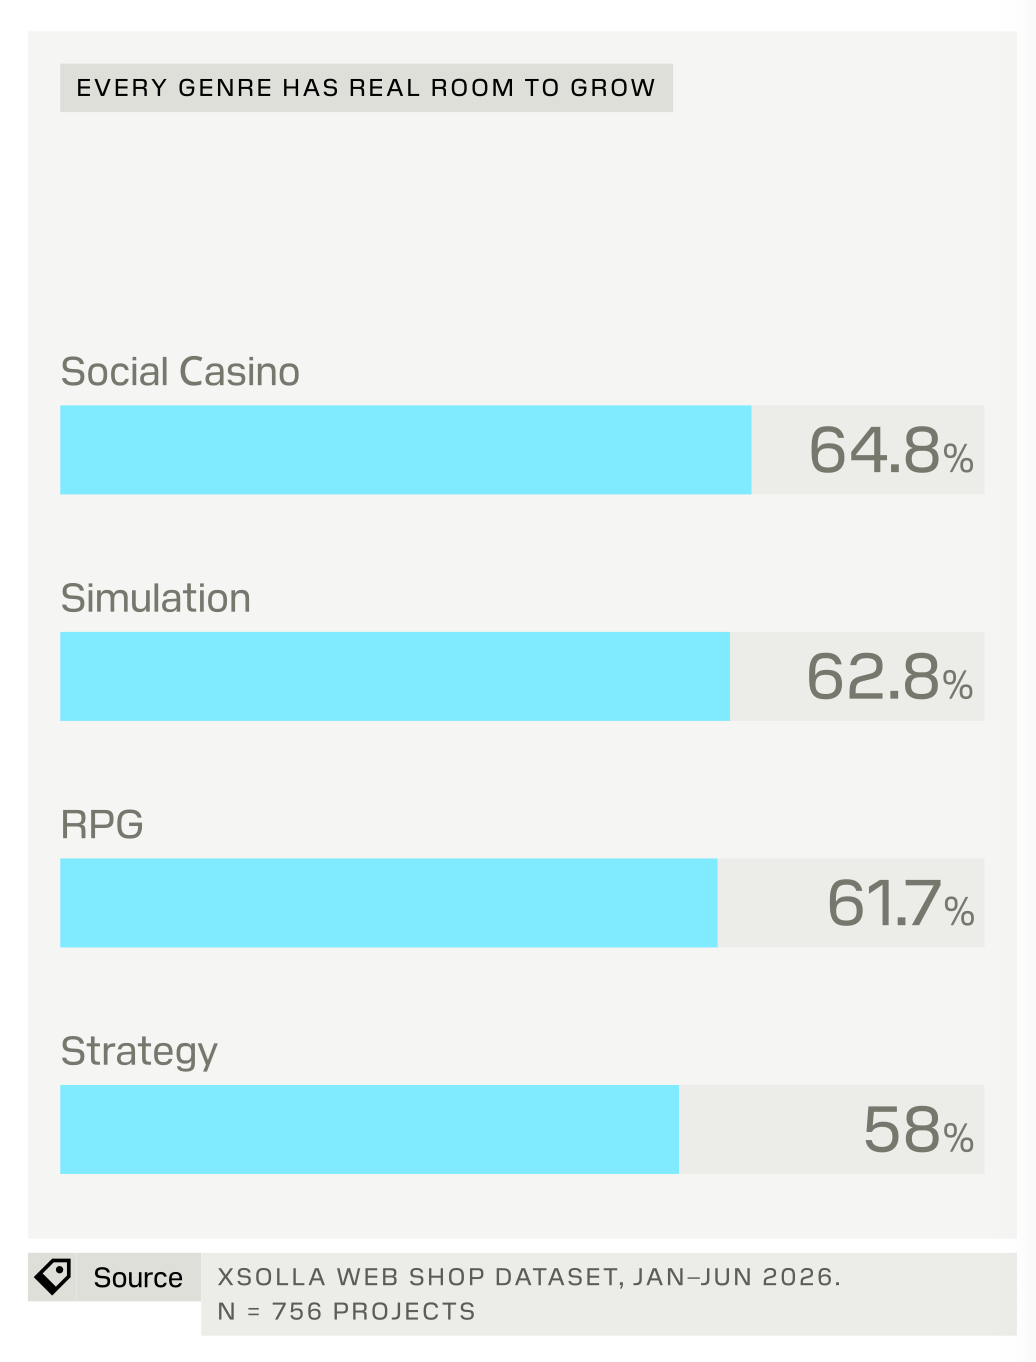
For the best web shops in each genre, D2C accounts for more than half of all player spend. The leaders are social casino (64.8%), simulation (62.8%), and RPG (61.7%). Xsolla notes that studios of any size, from indies to large publishers, can reach these numbers.
-
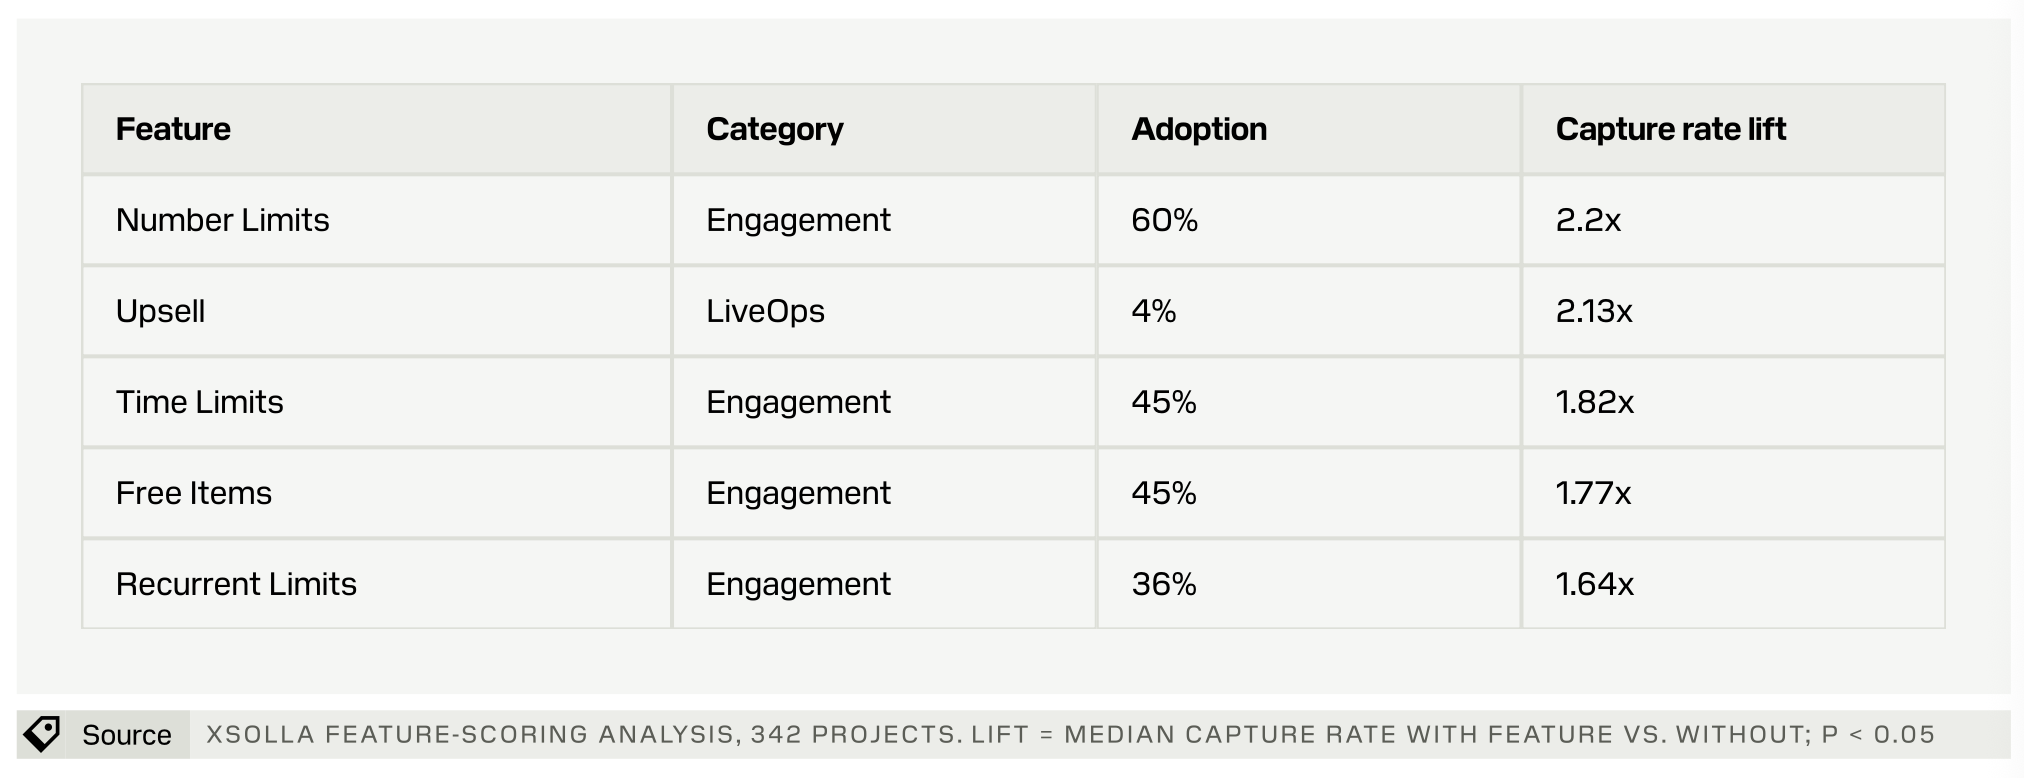
Xsolla calculated how individual web shop features relate to capture rate (342 projects). The standouts are Number Limits (limits on the number of purchases; capture rate increases 2.2x), upsell (2.13x), and time-limited offers (1.82x).
-
That said, only 4% of web shops use upsell mechanics. For comparison, 60% use purchase limits, and 45% use time-limited offers. Xsolla says the feature is seen as too labor-intensive.
❗️It’s important to note that this is a correlation: Xsolla compares the median capture rate of projects with and without a feature. These features may be adopted more often by teams whose web shops already perform well.
-
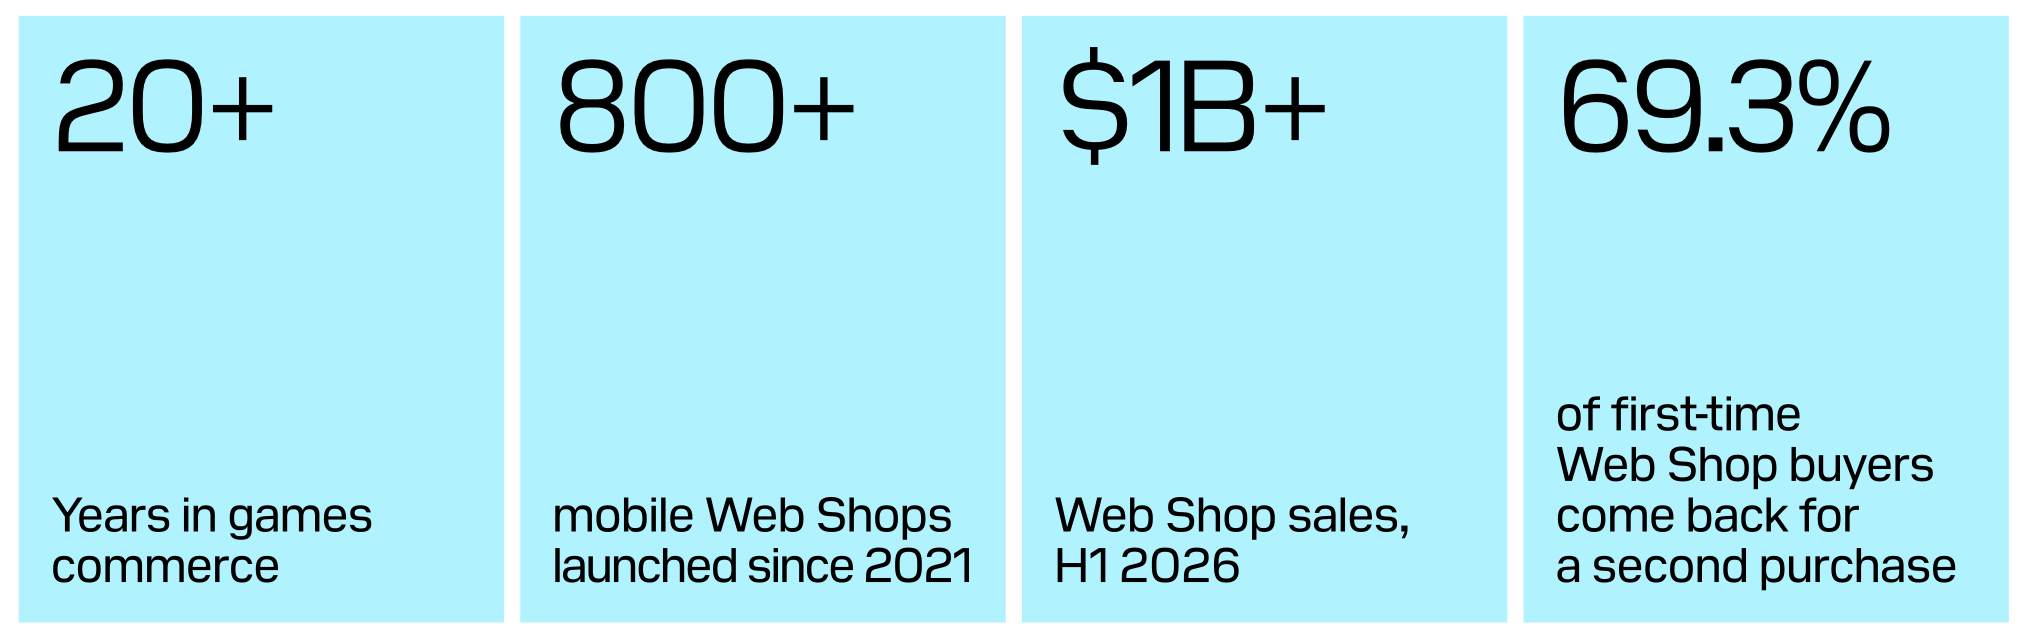
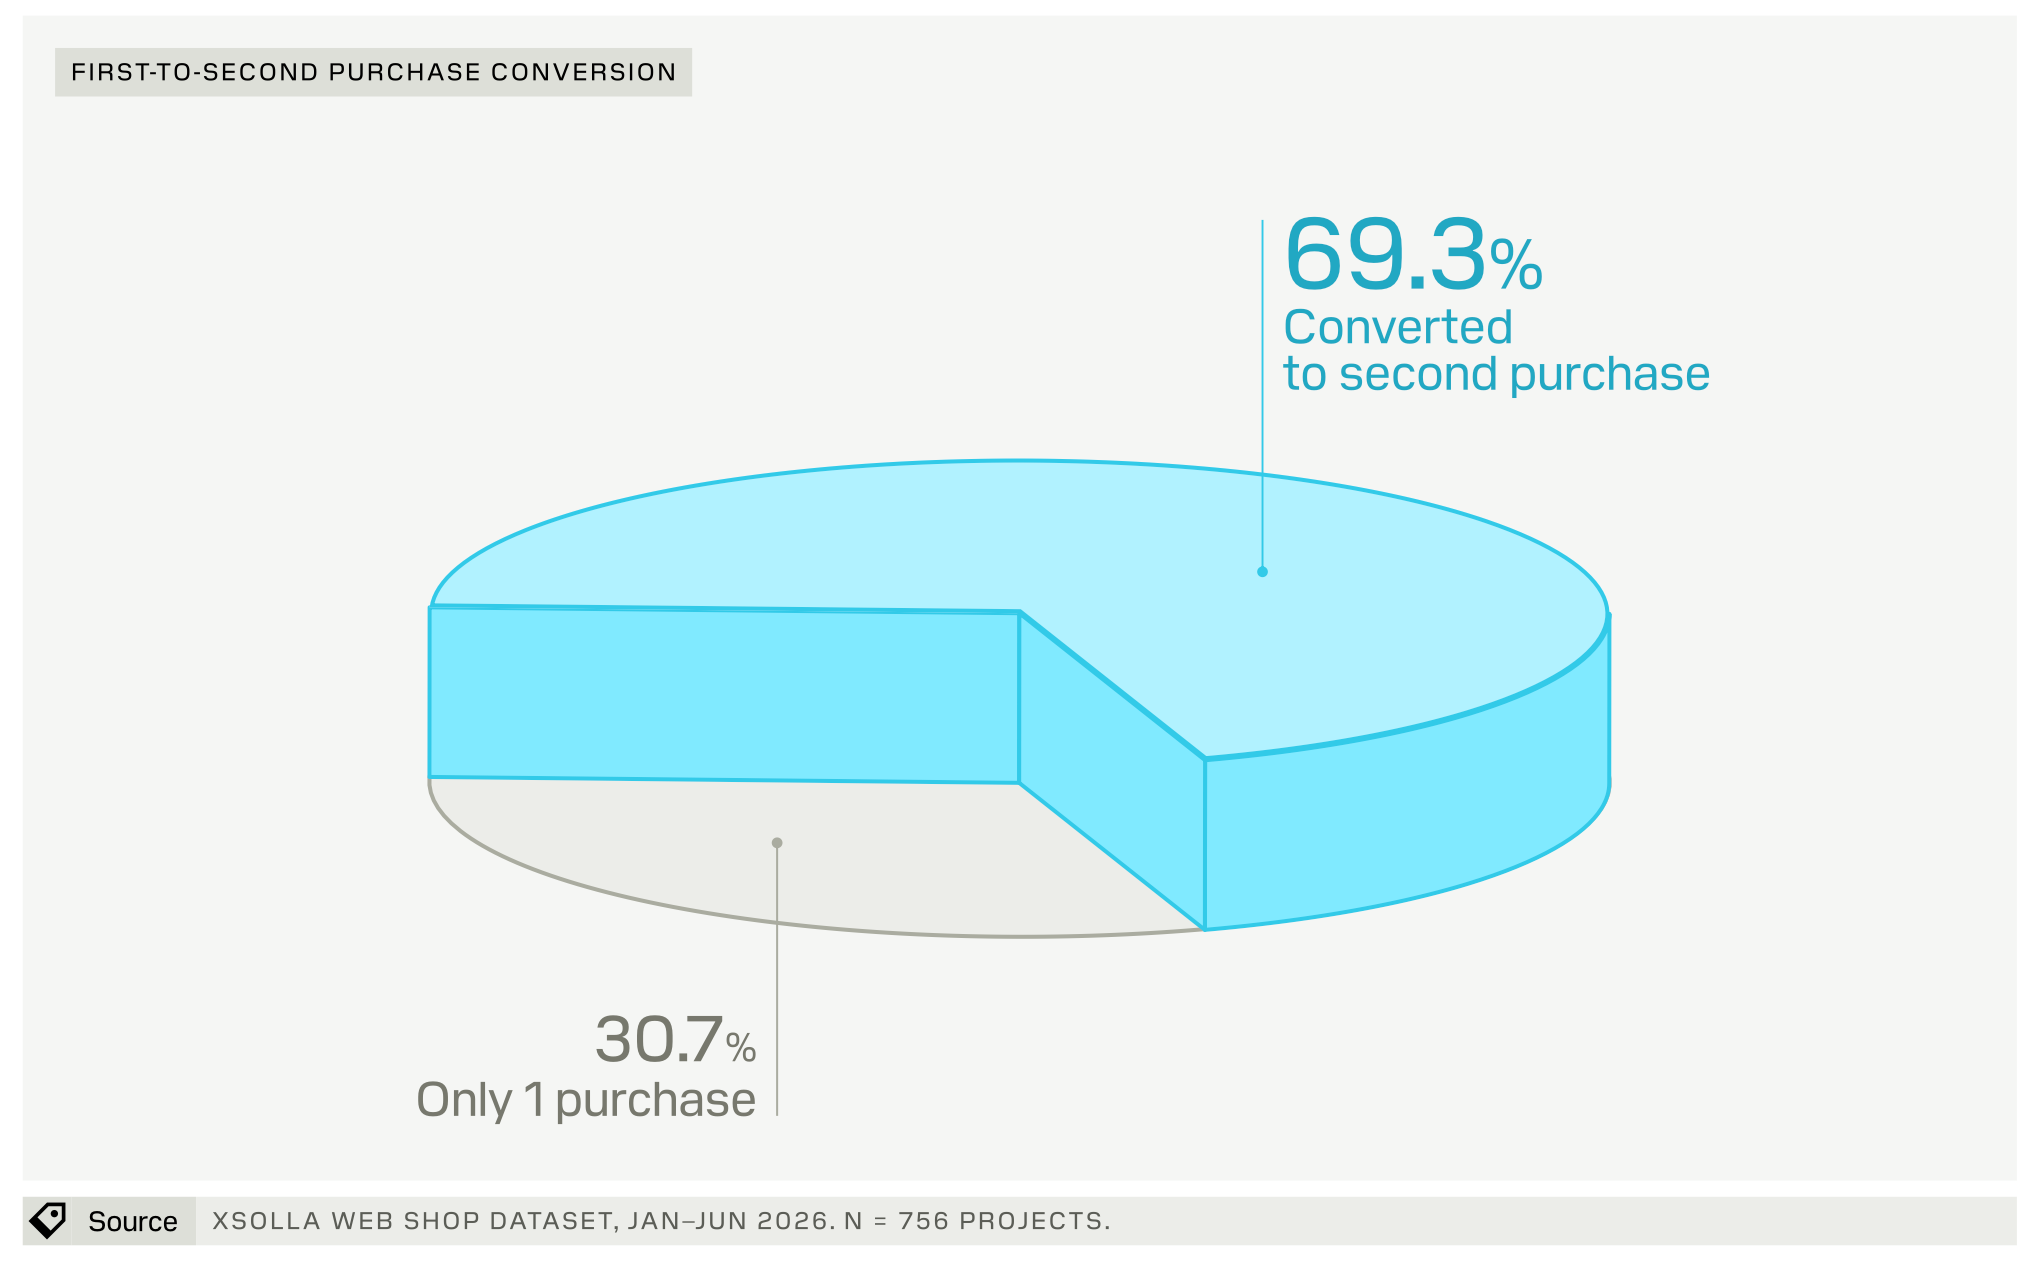
In H1’26, 4.87 million players made their first purchase in Xsolla web shops. 69.3% came back and bought at least one more time.
-
Repeat buyers account for 97.8% of web shop revenue, just under $1 billion. Their LTV is on average 20x higher than that of one-time buyers.
-
Retention features work differently. Referral programs lift both sales and DAU. Loyalty programs increase per-user spend and average order value. Daily rewards, on the other hand, more than double the number of active players but don’t directly affect sales.
-
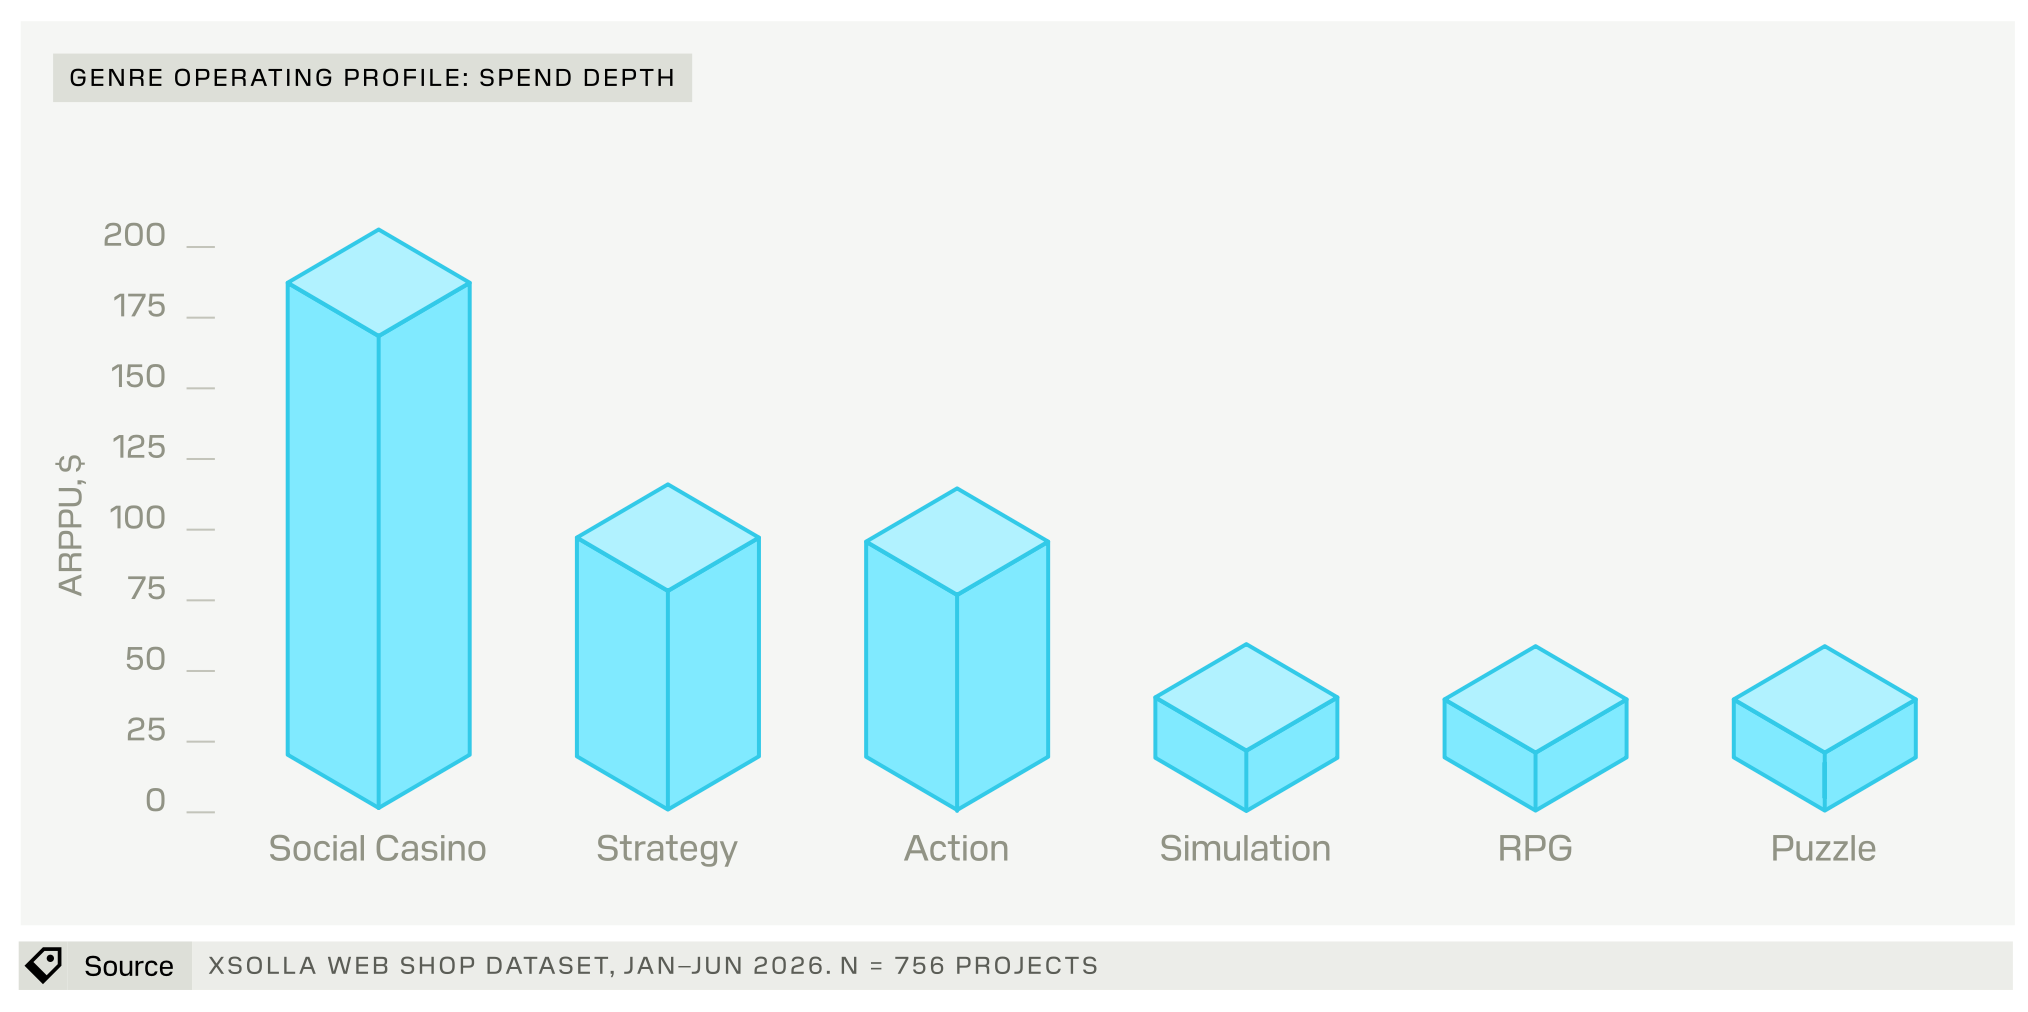
Social casino has the highest ARPPU in web shops ($204.70). Players in this genre buy less often, but their average order value is higher than in other genres. Strategy and action games have roughly half the ARPPU. RPGs, according to Xsolla, earn through frequent repeat purchases with small order values.
-
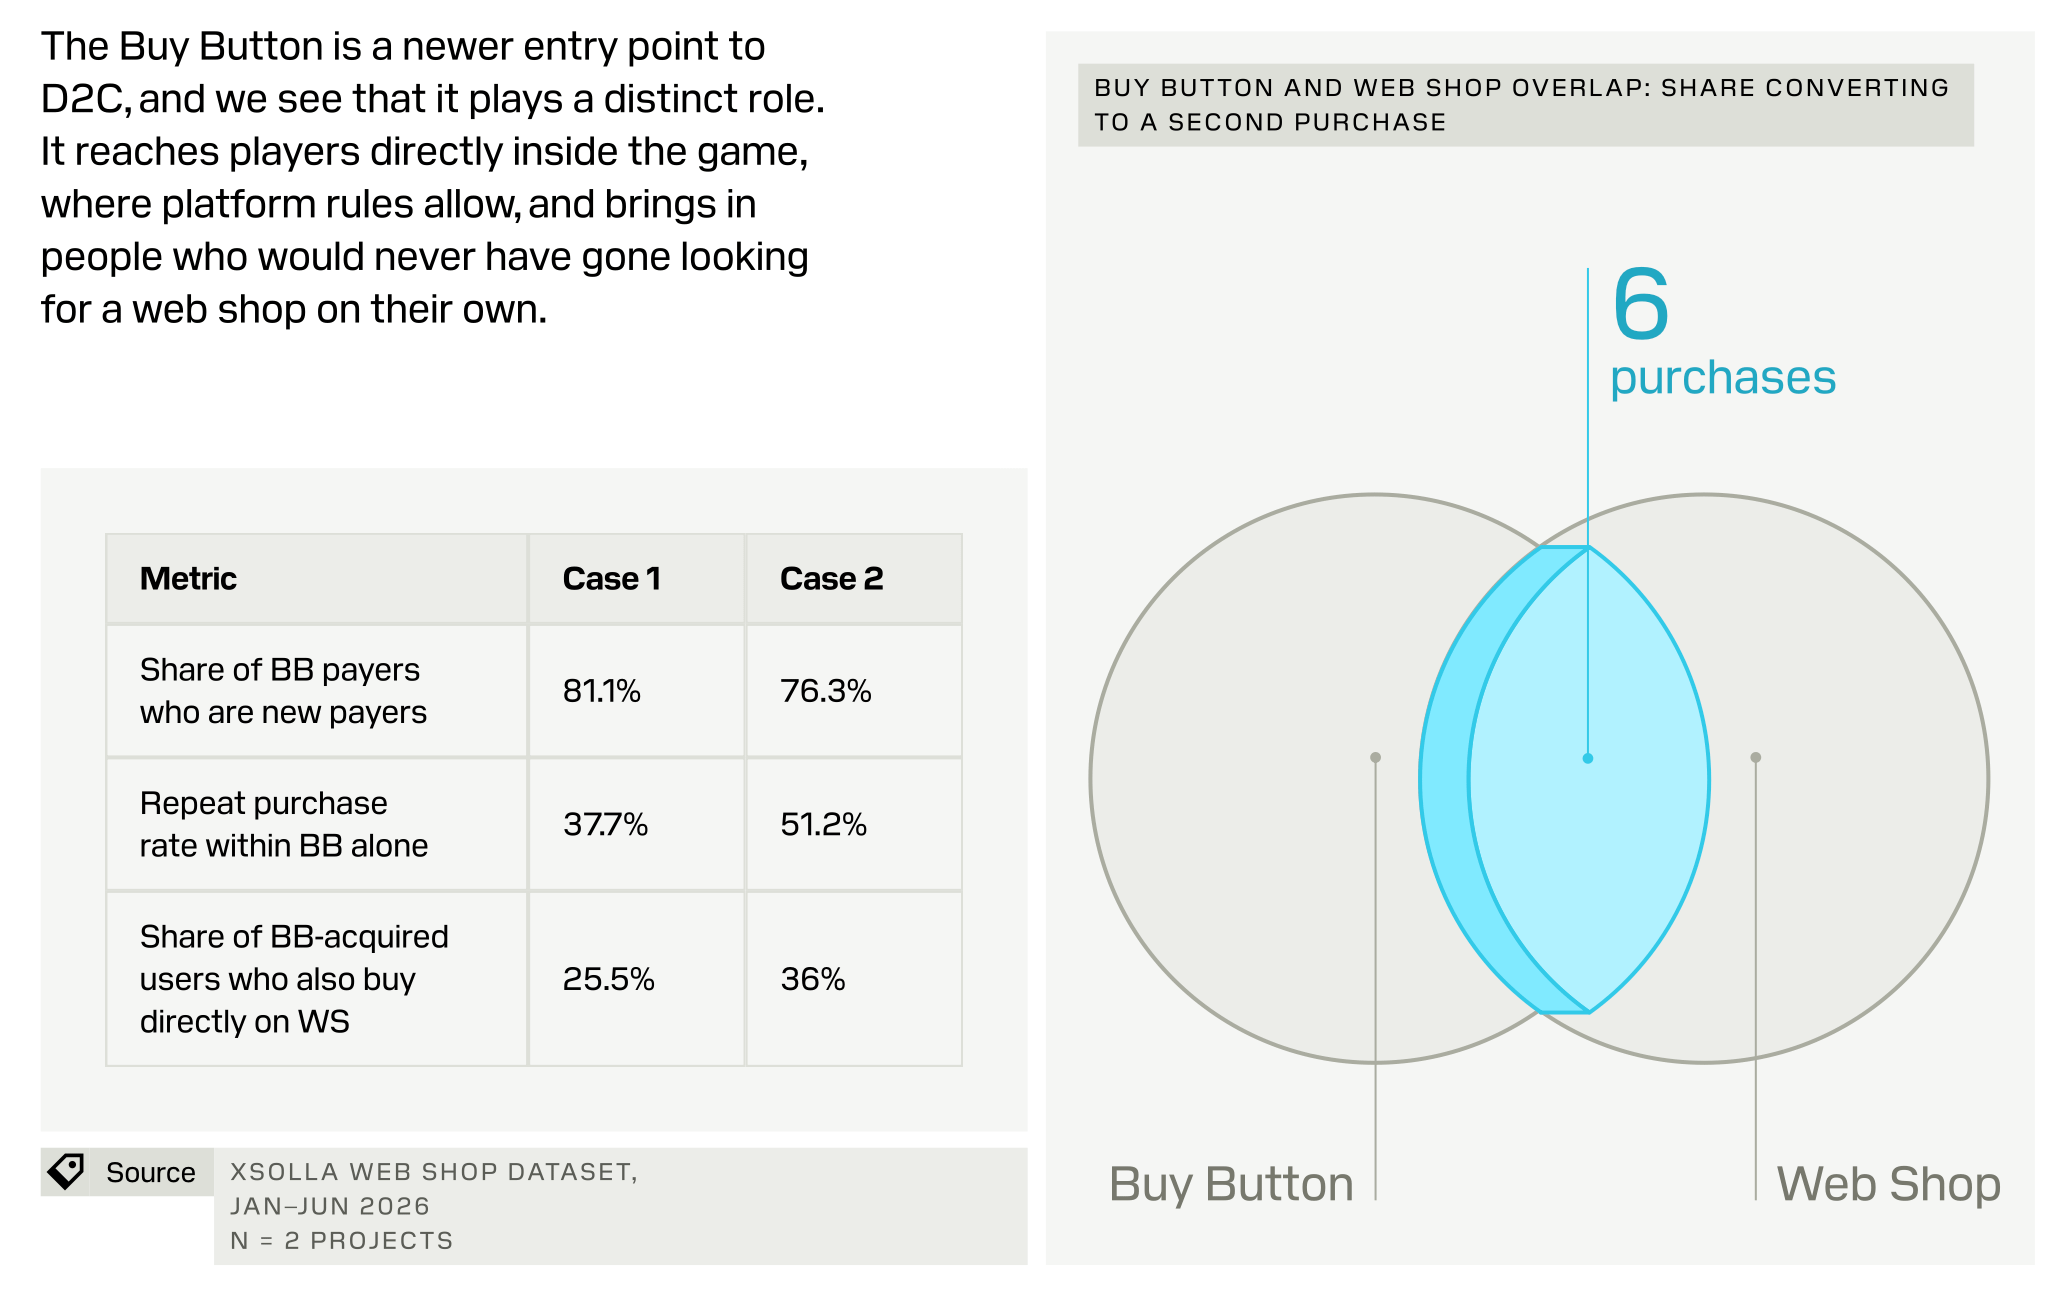
Xsolla also highlights the Buy Button, a purchase button right inside the game (where platform rules allow it). The data covers two projects. 81.1% and 76.3% of Buy Button payers are new payers. 25.5% and 36% of them later also buy directly in the web shop. These players make about six purchases on average across the two channels.
-
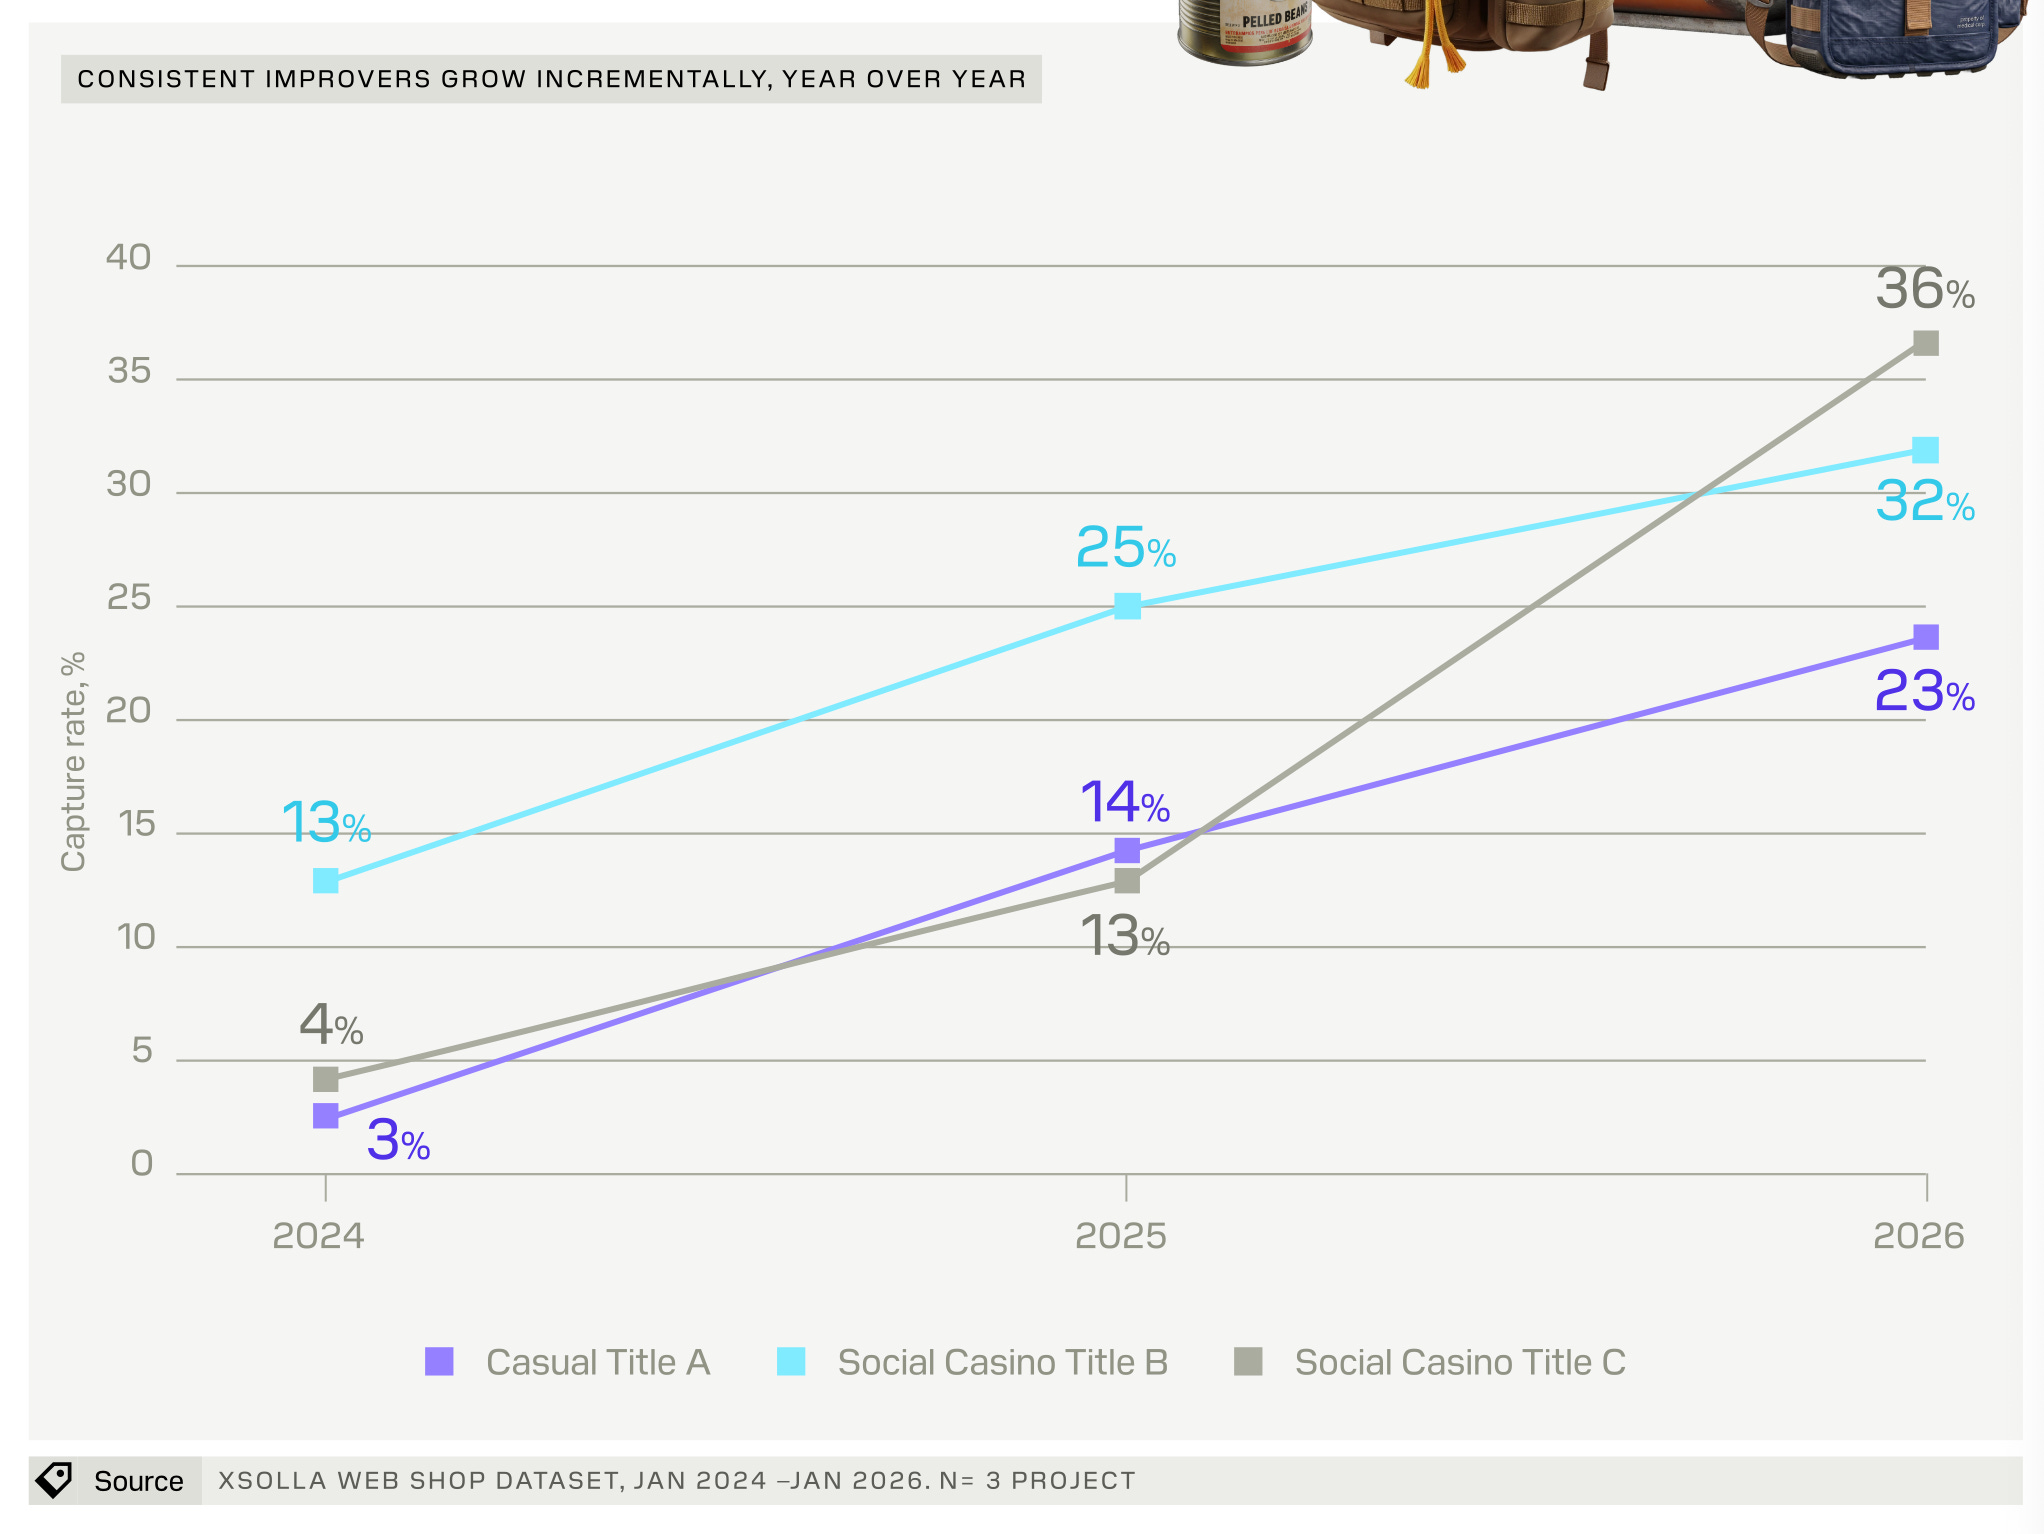
Of the 200+ projects with three years of data, roughly a quarter increased both sales and capture rate every year from 2024 to 2026. For example, one social casino title grew its web shop share from 4% in 2024 to 36% in 2026.
-
These projects added new features twice as fast as others. They started with catalog management, then promoted the web shop, then added conversion tools, and finally fine-tuned retention.
-
In a typical web shop, 5% of items generate about half of revenue. So a large catalog is often unnecessary.
-
Projects actively operating worldwide effectively live with two price levels: around $8 in Tier-1 markets and around $4 in emerging ones.
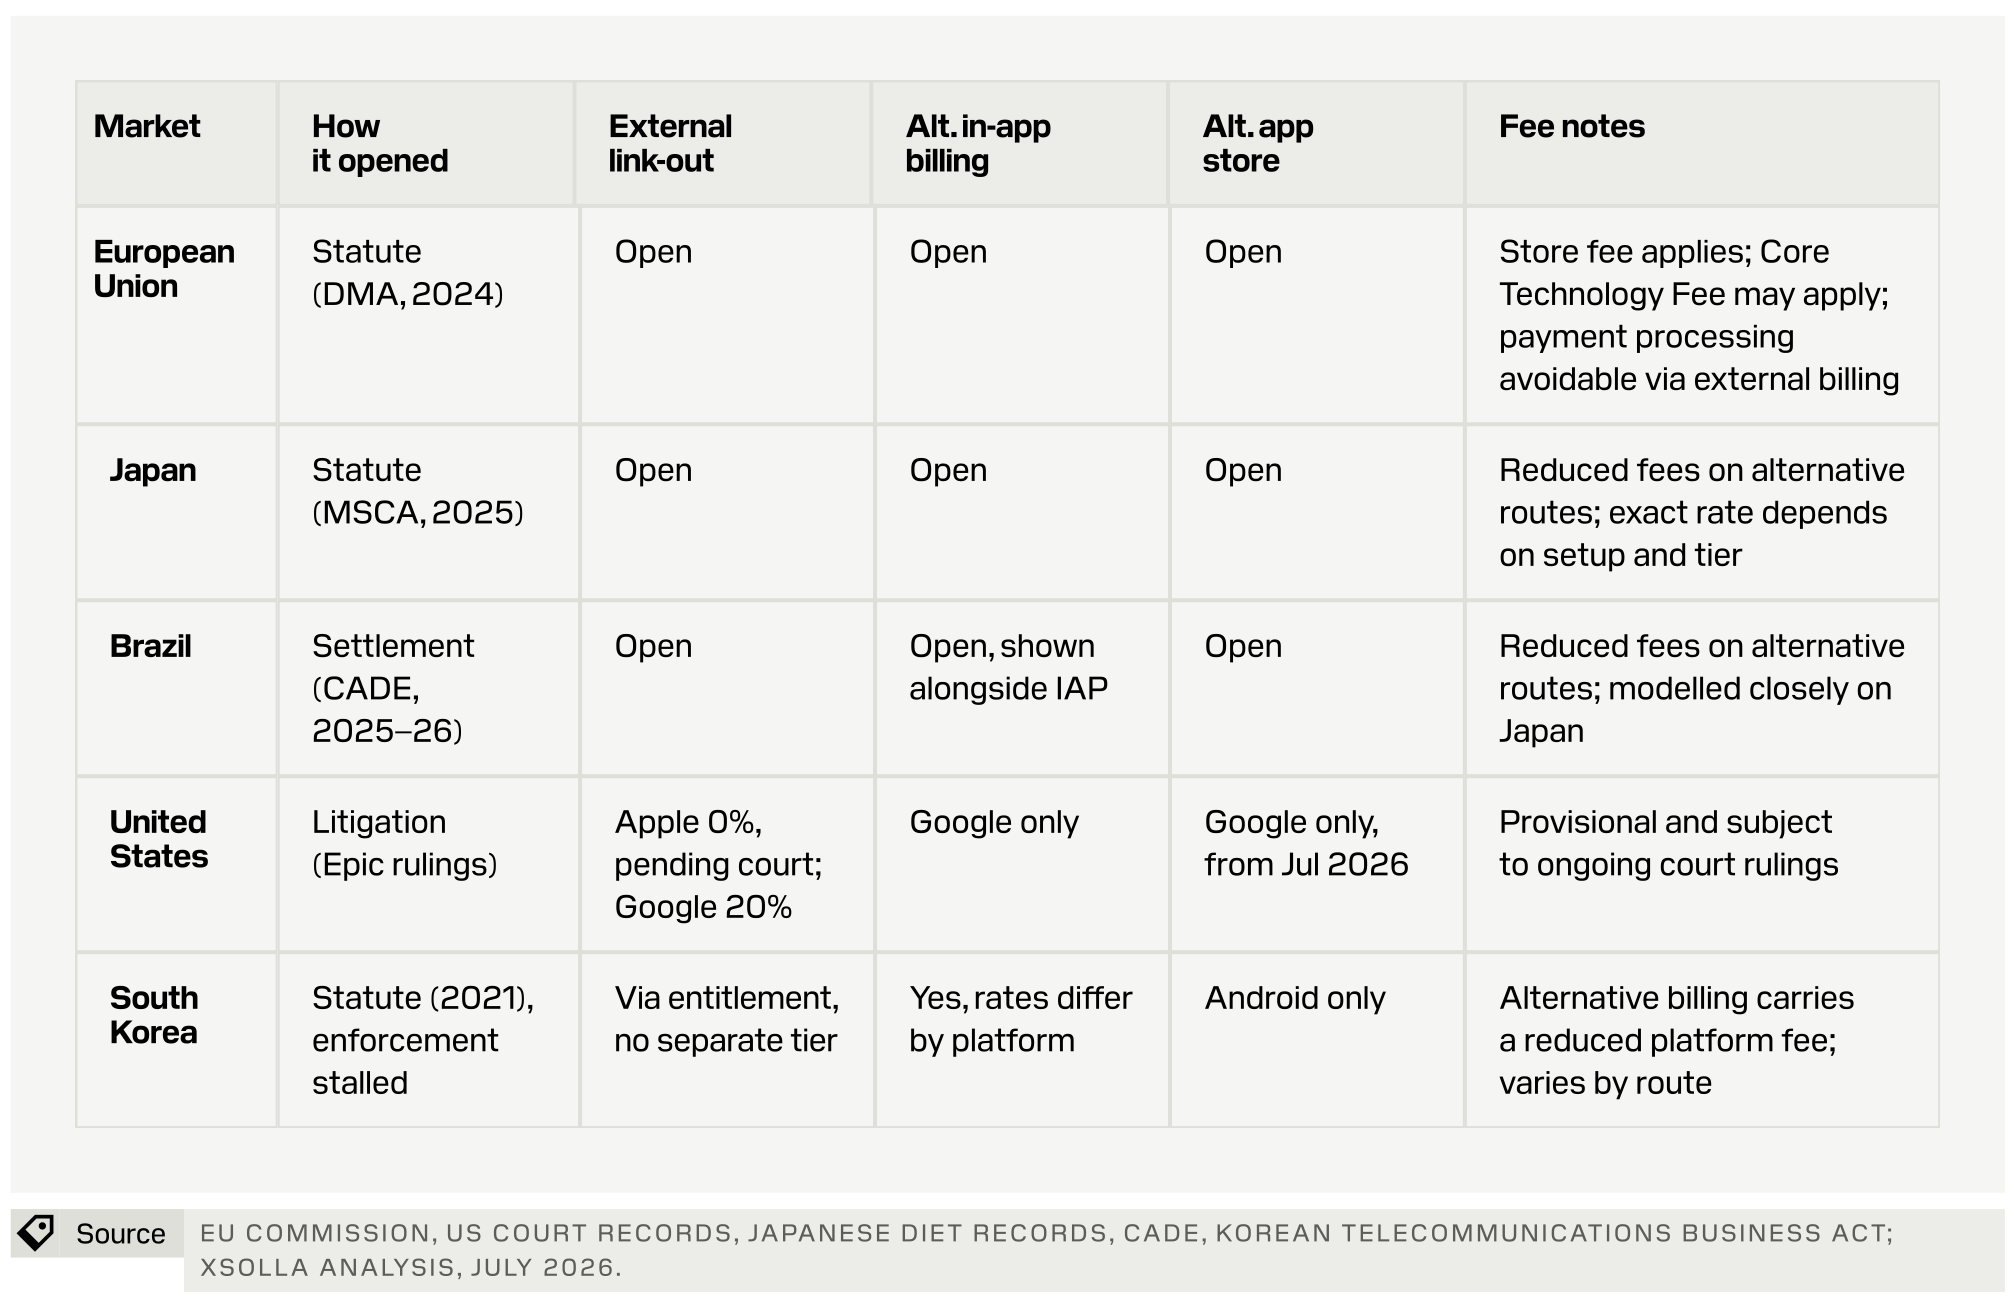
Regulatory data is current as of July 2026.
-
There is no single platform fee anymore. It’s fragmented, depends on many factors, and includes, among other things, payment processing costs.
-
In Xsolla’s view, if a country has passed a law, market practices can be considered stable, and businesses can adapt their decisions accordingly. If litigation is still ongoing (as in the US), you need to be ready for serious changes.