TL;DR: Gold has rebounded nearly 7% from its 3,869.96 low to around 4,133 as the US 10-year Treasury yield fell from its October peak of 5.365% to 4.847%. Both markets now sit at decisive thresholds, 4,170–4,200 for Gold and 4.815–4.800% for yields, which will show whether this is a reversal or only a corrective bounce.
Can Gold Turn a Rebound Into a Reversal?
Gold has rebounded nearly 7% from its recent low, but the rally is now approaching the level that could determine whether the selloff has genuinely ended or whether buyers are merely taking advantage of an oversold market. After bottoming at 3,869.96, the metal has rebounded toward 4,133 and broken through short-term resistance at 4,083.41. Yet a much more demanding test lies immediately ahead around 4,200.
At almost the same time, the US 10-year Treasury yield has fallen from its October peak of 5.365% to around 4.847%, bringing it within striking distance of critical support at 4.815–4.800%.
The two markets are therefore approaching important thresholds from opposite directions. Gold is climbing toward resistance, while Treasury yields are falling toward support.
Their recent moves have coincided with a significant shift in the US political and macroeconomic backdrop. The Democratic sweep of Congress has raised questions about future fiscal stimulus, the Treasury has adjusted its guidance on upcoming bond issuance, and oil prices have plunged as investors consider whether the election result could increase pressure for an end to the Iran war.
All three developments offer plausible channels for lower long-term Treasury yields, which can support Gold by reducing the opportunity cost of holding a non-yielding asset.
But a more favourable macro environment does not automatically mean that Gold’s downtrend has reversed.
That question now comes down to two technical tests: whether Gold can decisively clear 4,200 and whether the 10-year yield can break below 4.8%.
Follow Gold and the Treasury-yield test at 4,200 and 4.8% on the ActionForex Telegram channel.
Why Treasury Yields Are Falling: Fiscal Expectations, Bond Supply and Oil
Democratic Sweep Raises Expectations of Less Fiscal Stimulus
The first major change came from Washington’s new political landscape.
The Democratic sweep of Congress has left President Donald Trump facing divided government, potentially making additional fiscal stimulus more difficult to enact.
Markets have responded by reassessing how much further fiscal expansion might be achievable, and what that could mean for government borrowing, economic growth and Treasury yields.
Deutsche Bank’s Jim Reid linked the bond-market rally to the reduced prospects for stimulus, while Saxo’s Charu Chanana also highlighted the possibility that a stronger Democratic showing could limit expectations for further fiscal support.
The logic is straightforward: if investors expect less incremental fiscal stimulus, they may also anticipate less upward pressure on borrowing requirements and longer-term interest rates.
For Gold, that could be supportive through lower Treasury yields.
However, the election changes expectations, not the actual size of the US deficit overnight.
Divided government does not guarantee fiscal restraint. Existing spending commitments, debt-limit negotiations and future political compromises could still produce a very different outcome from the one markets are currently considering.
Treasury Refunding Guidance Fuels Speculation Over Lower Long-Dated Bond Supply
The second development came from the Treasury itself.
In Wednesday’s refunding announcement, the Treasury removed the words “at least” from its earlier guidance on how long coupon and floating-rate auction sizes would remain unchanged.
The revised wording indicated that auction sizes were expected to remain steady “for the next several quarters”.
That small change has attracted considerable attention because it suggests the Treasury may have greater flexibility to adjust its issuance structure sooner than previously indicated.
Some analysts expect more borrowing to be concentrated in shorter maturities, potentially accompanied by smaller auctions of 20-year and 30-year bonds.
For longer-dated Treasuries, the possibility of reduced future supply could help support prices and push yields lower.
This matters because the bond rally may not be explained entirely by expectations for slower growth or less fiscal stimulus. Changes in anticipated Treasury supply can influence long-term yields independently of the next Fed decision.
Yet no reductions in long-dated auction sizes have been announced. The revised guidance has encouraged speculation, but actual changes will depend on the Treasury’s funding requirements and market conditions.
Next week’s 10-year and 30-year auctions should therefore attract particular attention as investors assess demand for longer maturities.
Oil Plunges as Markets Hope for an End to the Iran War
The third development came from the energy market, where prices have fallen sharply.
Both Brent and WTI dropped approximately 8.3% on Wednesday, with Brent moving below $100 for the first time since October 7 and WTI settling around $88.
The decline coincided with growing hopes that the Democratic election victory could intensify pressure on President Trump to seek an end to the Iran war.
Elevated fuel prices have become a major political concern, and investors are considering whether the election result could alter the administration’s willingness to sustain or escalate the conflict.
Lower oil prices could ease expectations for energy-driven inflation, offering another possible explanation for falling nominal Treasury yields.
But this remains a highly uncertain development.
There is no confirmed peace agreement, and part of the oil-price decline began before the election result. The relationship between oil and Treasury yields also depends on changes in real rates and inflation expectations rather than energy prices alone.
The three developments therefore point toward a potentially more favourable environment for longer-dated bonds, but they operate through different channels and their relative contributions remain unclear.
For Gold, the resulting decline in yields is supportive. Whether it is sufficient to carry the metal through major resistance is another question.
The Real Test: Gold at 4,200 and Treasury Yield at 4.8%
Gold’s rebound has already achieved an important technical milestone by breaking above 4,083.41 resistance.
That confirms a short-term bottom at 3,869.96 and suggests that the immediate selling pressure from the preceding decline has eased.
However, the metal has not yet overcome the resistance needed to establish that the broader fall from 4,697.07 is reversing.
The critical zone is between approximately 4,170 and 4,200, where several technical barriers converge.
Meanwhile, the 10-year Treasury yield is approaching an equally important support region around 4.815–4.800%.
The most bullish outcome would be for Gold to break decisively above 4,200 while the 10-year yield falls firmly below 4.8%.
Such a combination would suggest that Gold is recovering beyond an ordinary short-term bounce while Treasury yields are also challenging their preceding upward trend.
The opposite scenario would be less encouraging.
If Gold fails to overcome 4,200 and subsequently breaks below short-term moving-average support, while the 10-year yield rebounds strongly from 4.8%, the recent moves would look more like corrections than lasting trend reversals.
The two markets need not move in perfect synchronization. Gold could continue strengthening despite a rebound in yields, or struggle at resistance even if yields decline further.
Nevertheless, a Gold breakout accompanied by a Treasury-yield breakdown would provide a stronger, more consistent cross-market signal than either move alone.
ActionForex’s Technical View: Gold, a Short-Term Bottom but Not Yet a Bullish Reversal
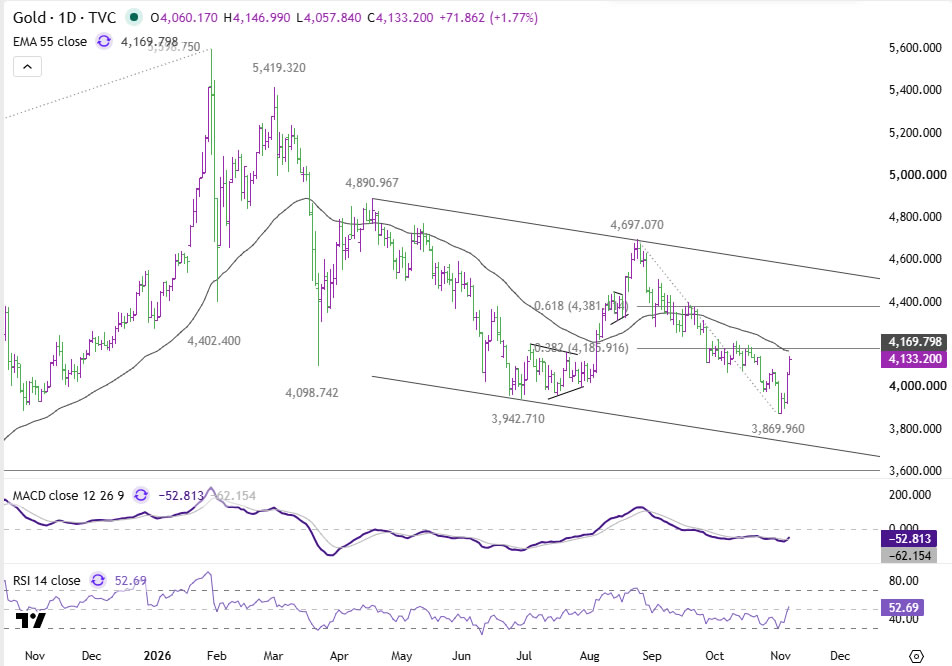
Gold’s recovery from 3,869.96 has been strong, and the break above 4,083.41 confirms short-term bottoming, supported by bullish divergence in the 4-hour MACD.
The rebound has now brought Gold close to a significant resistance confluence.
The daily 55 EMA lies around 4,169, followed by the 38.2% retracement of the decline from 4,697.07 to 3,869.96 at 4,185.91.
Previous resistance at 4,198.93 sits almost directly beneath the psychological 4,200 level.
Together, these barriers create a particularly important test of whether buyers have enough momentum to challenge the broader bearish structure.
A rejection from the 4,170–4,200 region, followed by a break below the 4-hour 55 EMA near 4,014, would keep the rebound corrective.
That would leave the broader downtrend from 4,697.07 intact and preserve the possibility of a later break below 3,869.96.
However, a decisive break above 4,200 would materially improve the outlook.
Such a move would suggest that Gold is reversing the entire decline from 4,697.07 and would open the way toward the 61.8% retracement at 4,381.11.
Short-term momentum has strengthened considerably, although the 4-hour RSI has already risen into overbought territory.
That leaves room for a temporary pause or pullback before Gold attempts to break through the resistance zone.
The crucial distinction is whether any such consolidation is followed by a sustained breakout or develops into a broader rejection.
ActionForex’s Technical View: US 10-Year Treasury Yield, Can 4.8% Hold?
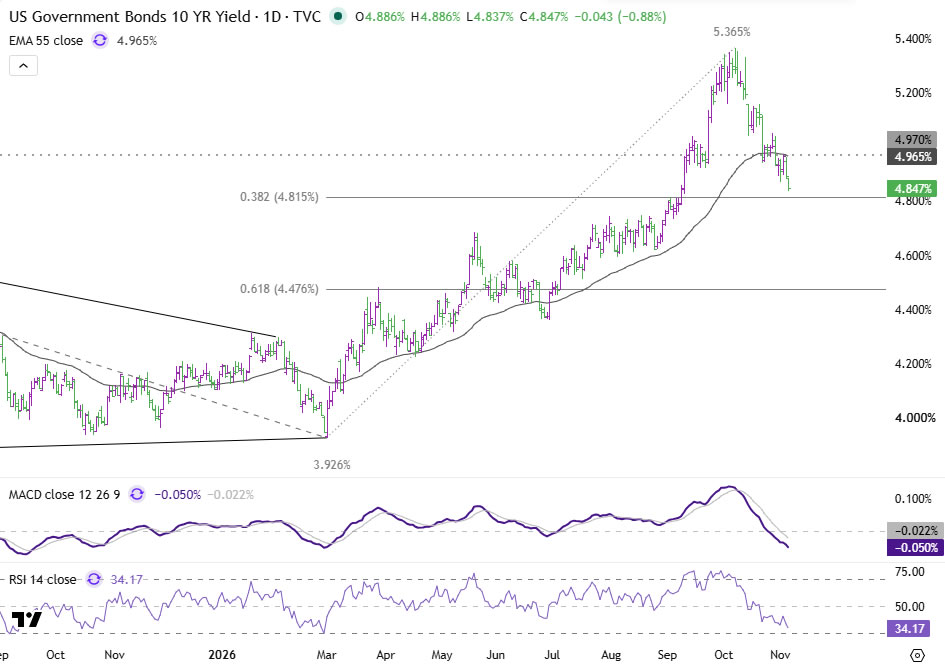
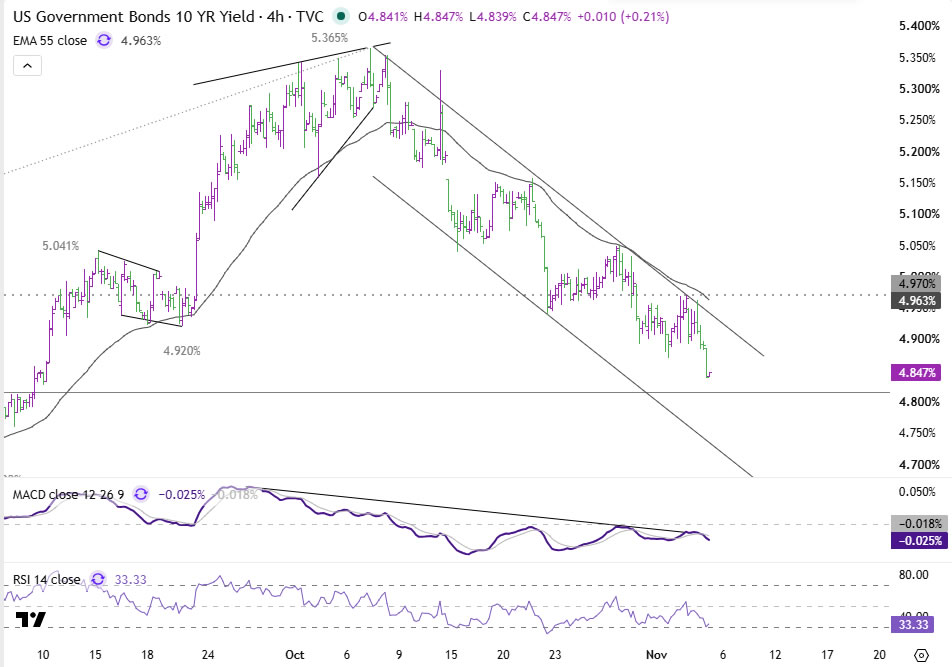
The US 10-year Treasury yield has extended its decline from the October high of 5.365%, reaching around 4.847%.
The rejection by the daily 55 EMA, currently near 4.965%, has reinforced the near-term bearish outlook.
The immediate focus is now the 38.2% retracement of the advance from 3.926% to 5.365% at 4.815%, just above the psychological 4.8% level.
A decisive break below this area would suggest that the yield decline is developing into a reversal of the broader advance from 3.926%, rather than remaining a correction from the October peak.
Under that scenario, the next major downside target would be the 61.8% retracement at 4.476%, with room for a deeper fall.
The alternative is that 4.8% provides sufficient support to halt the decline.
A strong rebound from that region, followed by a firm break above 4.970% resistance, would suggest that the fall from 5.365% may have completed as a correction.
That would preserve the medium-term upward trend in Treasury yields.
For Gold, such a recovery in yields could remove some of the support that has accompanied its recent rebound, particularly if the metal is also struggling to clear 4,200.
With the 10-year yield already close to the 4.815–4.800% support zone, this technical test could develop before Gold has completed its own attempt to overcome resistance.
Is Gold’s Rally Becoming Something More?
The latest rebound has brought Gold back above 4,000 and established a short-term bottom at 3,869.96.
At the same time, US Treasury yields have fallen sharply from their October highs, coinciding with reduced fiscal-stimulus expectations, speculation over future long-dated bond supply and a substantial decline in oil prices.
Those developments provide a more supportive macroeconomic backdrop for Gold than the one prevailing during the recent selloff.
But the critical technical confirmation is still missing.
Gold faces a major resistance zone around 4,170–4,200, while the 10-year Treasury yield is approaching equally important support around 4.815–4.800%.
A decisive Gold breakout above 4,200, accompanied by a breakdown in yields below 4.8%, would strengthen the case for a broader reversal and bring 4,381.11 in Gold and 4.476% in Treasury yield into focus.
Conversely, rejection at both thresholds would suggest that the recent rally in Gold and decline in yields remain corrective moves within their existing medium-term trends.
Incoming US employment data and next week’s Treasury auctions will provide additional tests of the market expectations underlying these moves.
Gold’s short-term recovery is established, but whether it develops into a genuine bullish reversal remains an open question. The next moves around 4,200 and 4.8% should provide the clearest answers.
Key Takeaways
- Gold has rebounded nearly 7% from 3,869.96 to around 4,133 and broke 4,083.41, confirming a short-term bottom.
- The US 10-year Treasury yield has fallen from 5.365% to around 4.847%, helped by reduced fiscal-stimulus expectations, the Treasury’s refunding wording change and an 8.3% drop in Brent and WTI.
- Gold’s key resistance zone is 4,170–4,200 (55 EMA near 4,169, 38.2% retracement at 4,185.91, previous resistance at 4,198.93); a decisive break would open 4,381.11.
- The 10-year yield’s key support is 4.815–4.800%; a break below would target 4.476%, while a rebound above 4.970% would suggest the decline was corrective.
- A Gold breakout combined with a yield breakdown would be a stronger signal than either alone, with next week’s 10-year and 30-year auctions and the US employment data as further tests.
Stay ahead of Gold’s test at 4,200 and the Treasury-yield test at 4.8%—join the ActionForex Telegram channel for regular market updates and analysis.