
Quick overview
- Spot gold (XAU/USD) is trading near $3,992, down about 0.7% and below $4,000 due to strong US economic data.
- The US Q3 GDP grew at a 3.4% annualized rate, and PCE inflation rose 0.5%, supporting the likelihood of a December Fed rate hike.
- Gold’s key support level is $3,978.64, with bearish sentiment prevailing below $4,030.12, targeting lower levels if breached.
- Despite lower Treasury yields and oil prices, gold has continued to decline, indicating traders are positioning for potential rate hikes.
Quick Answer: Spot gold (XAU/USD) is trading near $3,992 in Friday’s Asian session, October 30, down about 0.7% and back below $4,000. Strong US data on Thursday, with GDP growing 3.4% and monthly PCE inflation jumping 0.5%, kept a December Fed hike in play. The level that matters is $3,978, with gold’s weekly and monthly close later today.
My view: bearish below $4,030.12. A break under $3,978.64 targets $3,952.52 and $3,921.80, while a 2-hour close above $4,030.12 would weaken that call.
Strong Growth and Sticky Inflation Back the December Hike
Q3 GDP, the total value of everything the US economy produces, grew at a 3.4% annualized rate, beating the 3.2% forecast and accelerating from 2.2% in Q2. “Annualized” means the quarterly pace projected over a full year. September PCE, the Fed’s preferred inflation gauge, rose 0.5% on the month and 3.6% on the year, while core PCE, which strips out volatile food and energy prices, rose 3.1%. Weekly jobless claims fell to about 194,000, a sign companies are still holding on to workers.
This is the hardest mix for gold. A strong economy gives the Fed room to raise rates without much fear of recession, and higher rates make interest-paying assets more attractive than gold, which pays nothing. Traders now price about a 75% chance of a December hike, Reuters reported, down from around 83% after Wednesday’s Fed meeting. Spot gold fell 0.4% to $4,006.06 by 0036 GMT, while US December gold futures, contracts to buy gold at a fixed price in December, slipped to $4,018.50.
Gold Fell Even When Yields and Oil Helped
On Thursday, the 10-year Treasury yield fell as investors moved into bonds during a tech sell-off that knocked the Nasdaq 1.44% lower, with Alphabet down 13.3%. Brent, the global oil benchmark, settled lower at $114.88. Lower yields and cheaper oil would normally help gold, yet it still lost more than 1%, and silver dropped about 3%.
In yesterday’s forecast, I said sellers were back in charge after the $4,074 rejection, and Thursday’s drop confirms it. When gold ignores its usual supports, I read it as traders positioning for a December hike rather than reacting to daily headlines. Even with hike odds easing from 83% to 75%, buyers have not stepped in.
What’s Next for Gold
The Bank of Japan announces its decision today, and gold’s weekly and monthly close comes tonight. Reuters notes gold is heading for a modest weekly gain but a second straight monthly loss, so a close below $4,000 would add weight to the bearish case going into November. The US midterm elections follow on November 3, and the World Gold Council’s quarterly demand report in early November will show whether central bank buying held up in Q3.
Gold Technical Analysis: Sellers Push Gold Toward $3,978 Support
On the 2-hour chart, gold has slipped back below $4,000 after its bounce from $3,978.64 was rejected at $4,068.45, just under a falling trendline from the October 8 high, a line connecting lower highs, and the slower moving average at $4,055.80. A moving average tracks the average price over time. Sellers have kept control since that rejection, and price is now close to the $3,978.64 support, the October 23 to 25 lows.
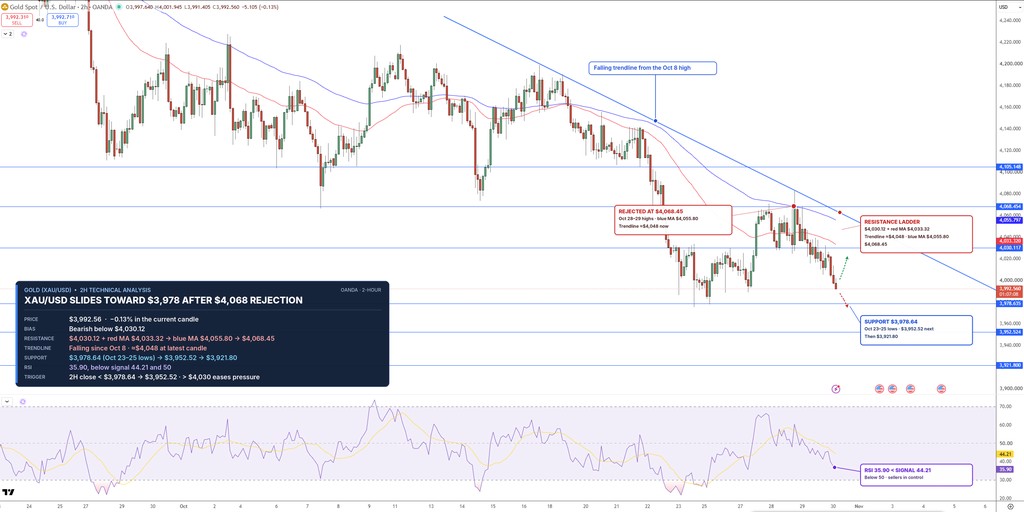
The RSI, a momentum gauge from 0 to 100, sits at 35.90, below its signal line at 44.21 and below 50, which favors sellers.
I stay bearish below $4,030.12, with the faster moving average just above at $4,033.32. A 2-hour close under $3,978.64 targets $3,952.52, then $3,921.80. A close above $4,030.12 would weaken that view and open the trendline near $4,048, then the slower moving average at $4,055.80 and $4,068.45.
- Resistance: $4,030.12 | $4,033.32 | $4,055.80 | $4,068.45
- Support: $3,978.64 | $3,952.52 | $3,921.80
Today’s FXLeaders Live Session
Today’s FXLeaders live session is an RSI and MACD masterclass on momentum, divergence and reversal signals, the same tools behind the RSI reading on the gold chart above.
FAQs
Why is gold below $4,000 today?
Strong Q3 GDP and a 0.5% monthly jump in PCE inflation kept a December Fed hike in play. Gold fell even though Treasury yields and oil eased on Thursday.
What did PCE inflation show for September?
Headline PCE rose 0.5% on the month and 3.6% on the year, while core PCE rose 3.1%. That keeps inflation well above the Fed’s 2% target.
What is the next support for gold?
The first support is $3,979, the October 23 to 25 lows. A break below it would open $3,953, then $3,922.

Arslan Ali Butt
Lead Markets Analyst – Multi-Asset (FX, Commodities, Crypto)
Arslan Ali Butt serves as the Lead Commodities and Indices Analyst, bringing a wealth of expertise to the field. With an MBA in Behavioral Finance and active progress towards a Ph.D., Arslan possesses a deep understanding of market dynamics.
His professional journey includes a significant role as a senior analyst at a leading brokerage firm, complementing his extensive experience as a market analyst and day trader. Adept in educating others, Arslan has a commendable track record as an instructor and public speaker.
His incisive analyses, particularly within the realms of cryptocurrency and forex markets, are showcased across esteemed financial publications such as ForexCrunch, InsideBitcoins, and EconomyWatch, solidifying his reputation in the financial community.