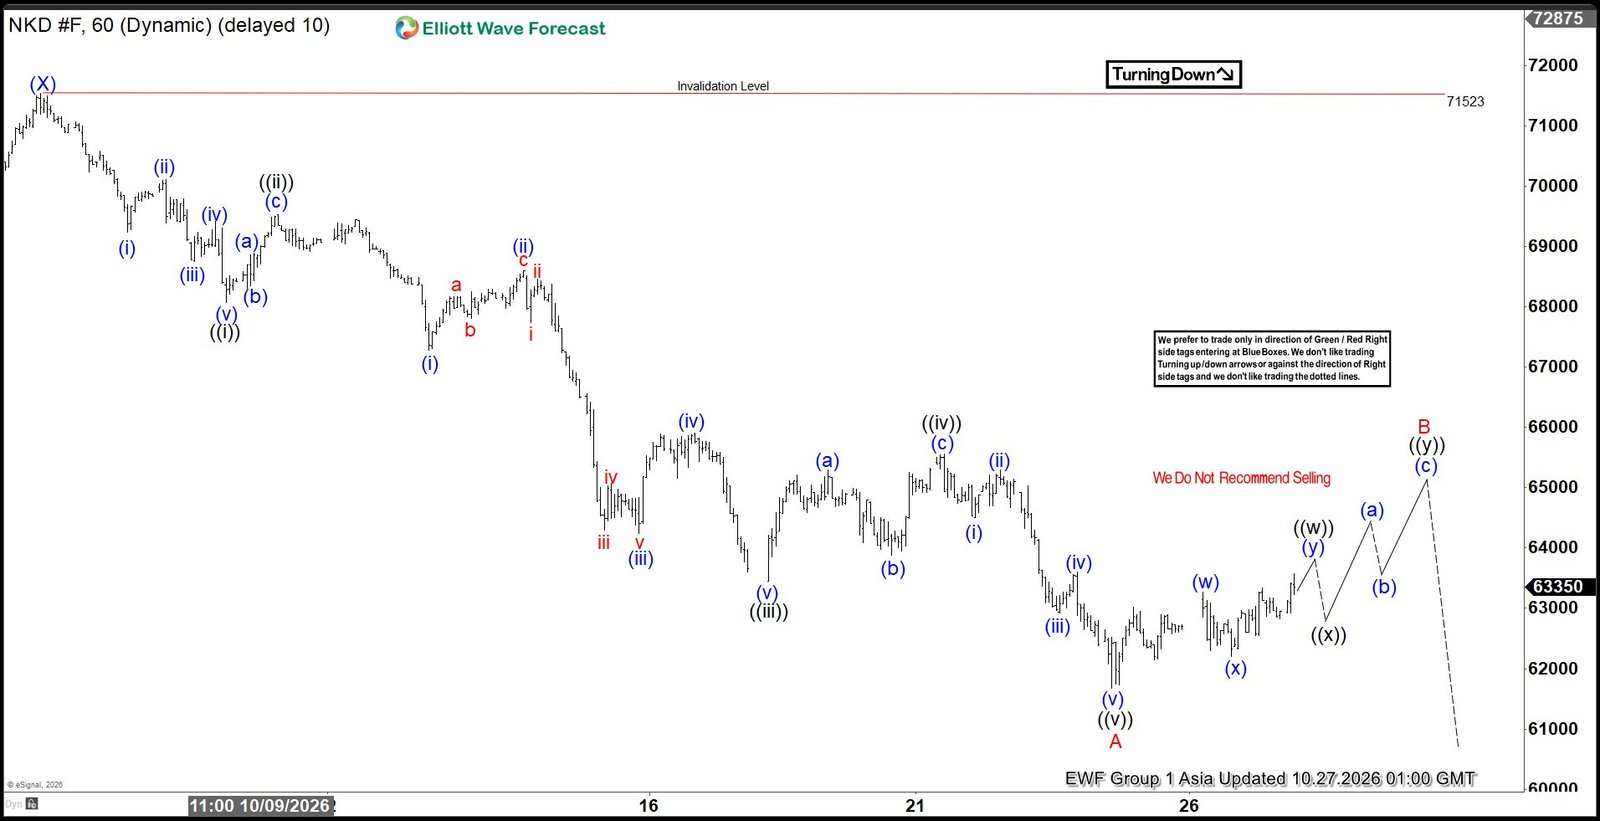
Nikkei Futures (NKD) continues to favor a larger-degree double three Elliott Wave correction from the June 22, 2026 high. The decline from that peak completed wave (W) at 60,575. Thereafter, the market staged a corrective recovery in wave (X), which ended at 71,523. With wave (X) in place, the index has resumed lower in wave (Y), the final leg of the corrective sequence. Based on the current structure, the downside objective for wave (Y) is derived from the 100% to 161.8% Fibonacci extension of wave (W). This projection identifies a target zone between 58,400 and 50,348.
From an Elliott Wave perspective, wave (Y) is unfolding as a zigzag pattern. Within this structure, wave A has already completed at 61,680. The decline into wave A developed as a clear five-wave impulsive sequence, as illustrated on the 1-hour chart. The completion of wave A suggests that the market has entered wave B, which represents a corrective recovery against the broader bearish trend.
Wave B is currently in progress and is expected to correct the decline from the October 6, 2026 high before selling pressure resumes. Although additional upside can develop in the near term, the rally is expected to remain corrective in nature. As long as the key pivot at 71,523 remains intact, the broader outlook continues to favor further downside. Consequently, traders should expect any recovery to fail in a three-swing or seven-swing structure.
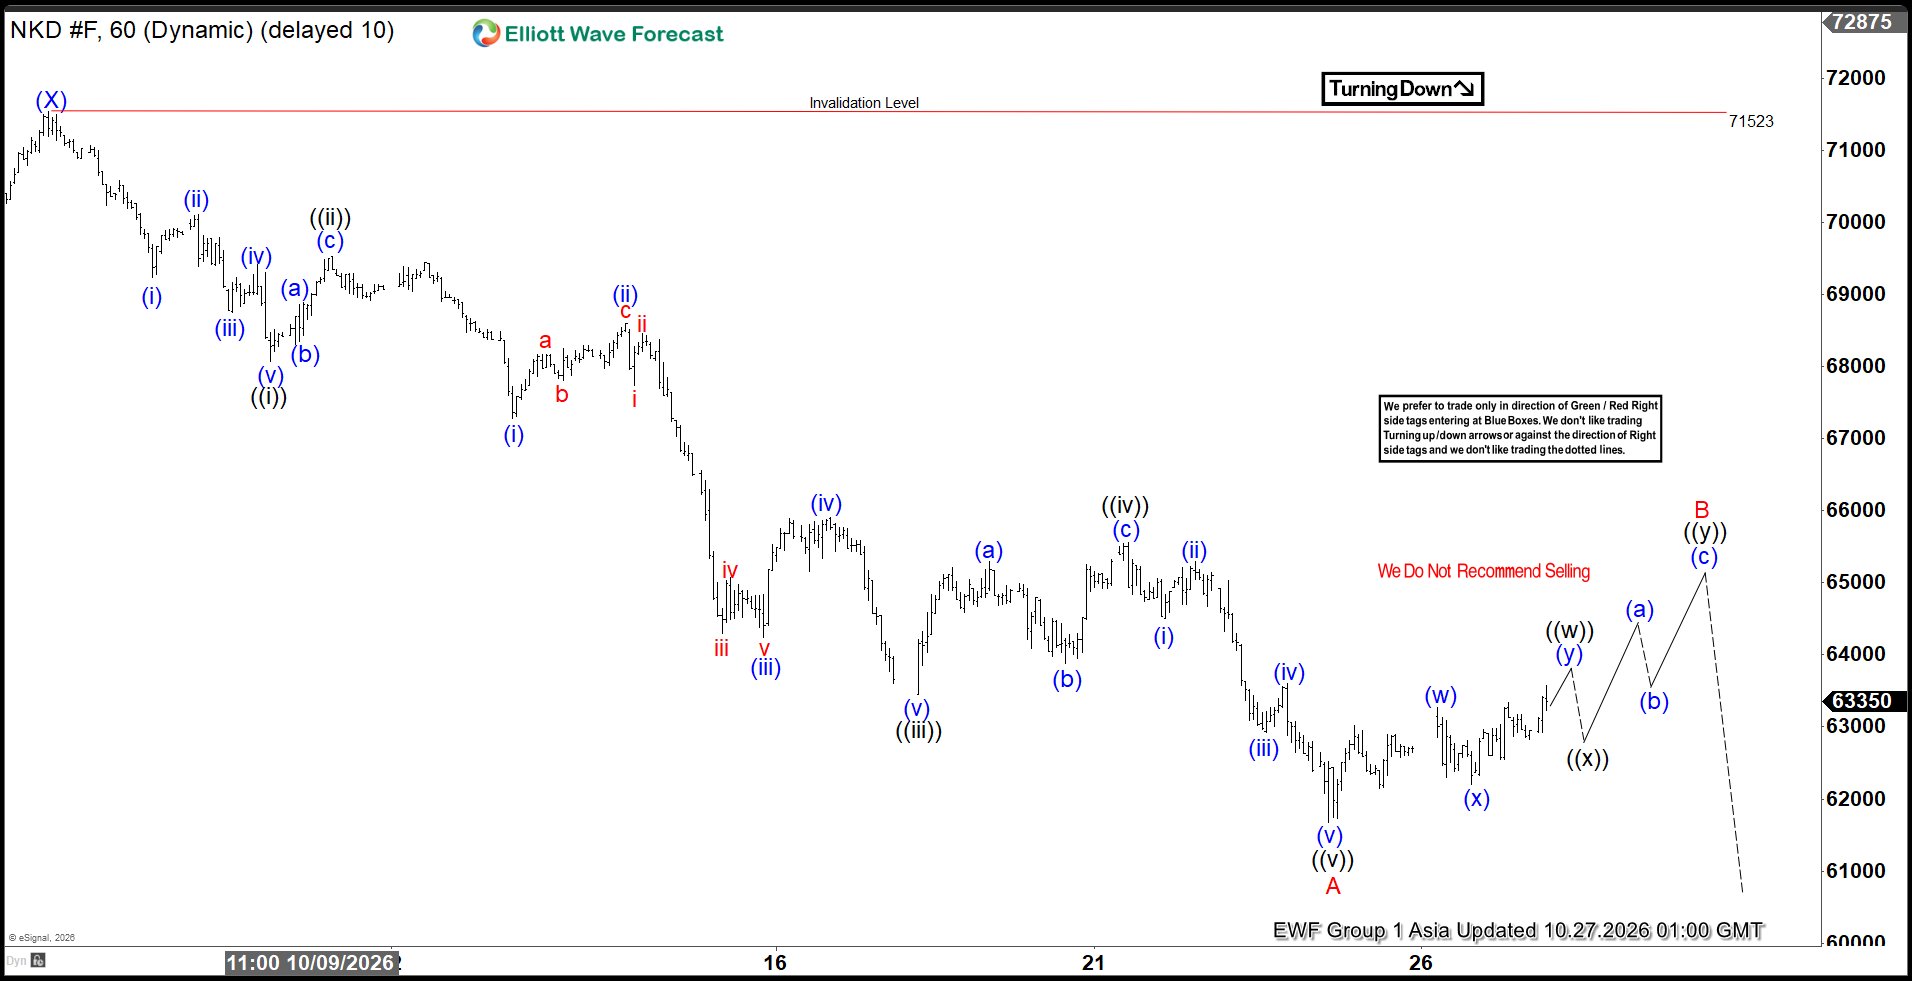
Nikkei Futures (NKD) 60 Minute Elliott Wave Chart
NKD Elliott Wave Video
You are currently viewing a placeholder content from Default. To access the actual content, click the button below. Please note that doing so will share data with third-party providers.