By Crispus Nyaga Crispus N.
Bullish view
-
Buy the BTC/USD pair and set a take-profit at 87,200.
-
Add a stop-loss at 79,000.
-
Timeline: 1-2 days.
Bearish view
-
Sell the BTC/USD and set a take-profit at 79,000.
-
Add a stop-loss at 87,200.
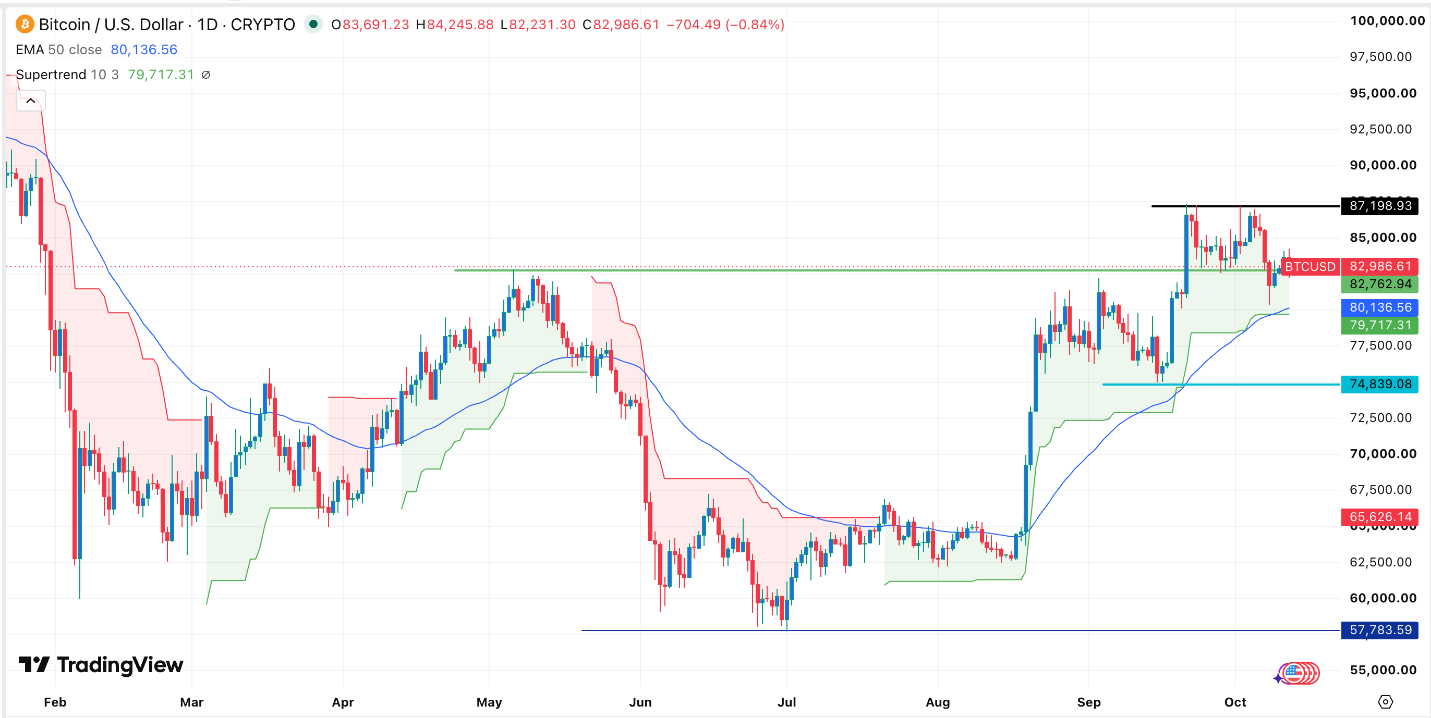
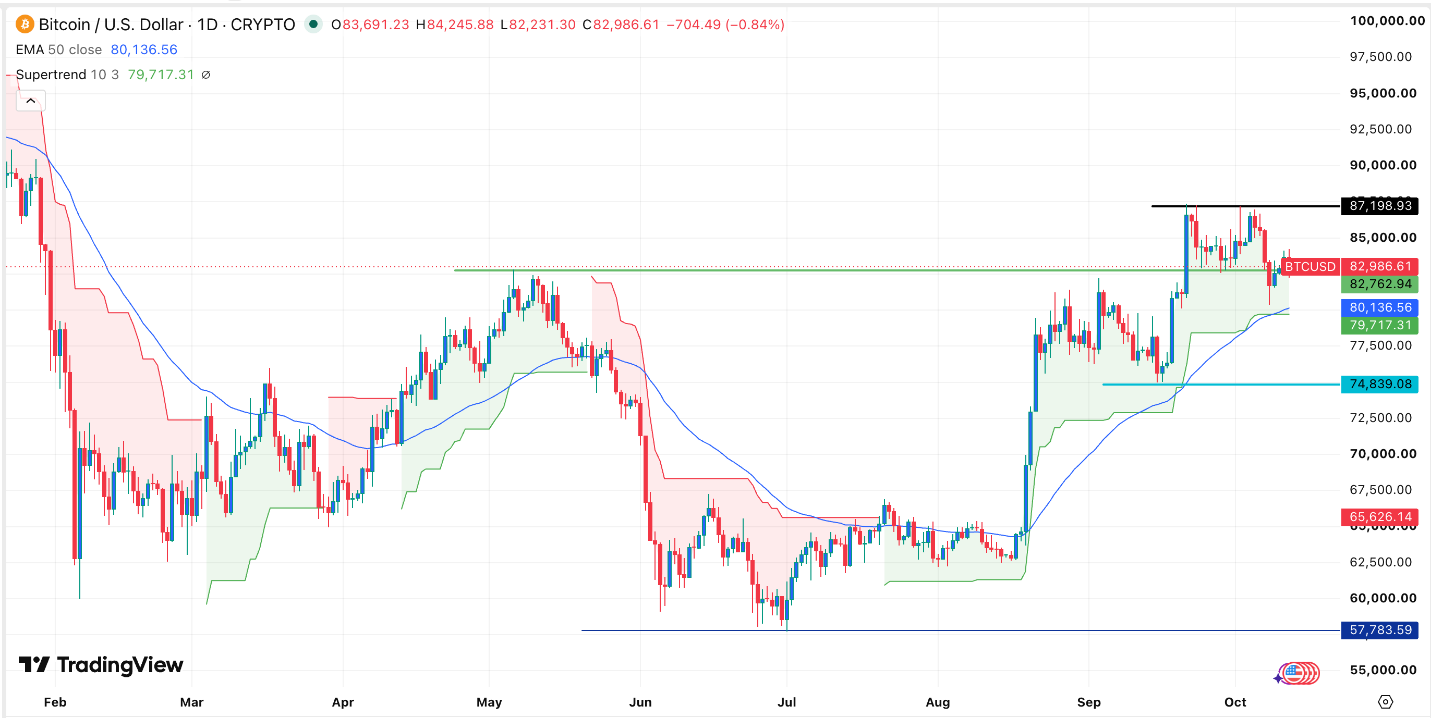
Bitcoin price was in a narrow range on Tuesday morning as demand for the coin remained under pressure amid the rising bond yields. BTC/USD was trading at 82,910, down modestly from this month’s high of 87,200. This performance will be in the spotlight as investors wait for the US inflation report.
Bitcoin’s demand has waned this month, following the surge experienced in the last three months. Data shows that spot Bitcoin ETFs added $172 million in inflows in July, followed by $3.52 billion and $2.65 billion in the next two months. These funds have now lost over $300 million in assets this month.
Bitcoin’s demand has also waned in the futures market where open interest has continued falling this month. The retreat coincided with the rising US bond yields, with the 10-year rising to 5.23% and the 30-year hitting 5.60%.
Bitcoin also wavered as crude oil prices continued rising. Brent, the global benchmark, rose to $107, while the West Texas Intermediate (WTI) moved to $94. The average gasoline and diesel prices have also continued rising this week.
Focus now shifts to the upcoming US consumer inflation report. Economists expect the upcoming report to show that the headline CPI rose to 3.6% in September, while core CPI moved to 2.6%. These are important numbers because they will provide more information on what the Fed will do.
Bitcoin also wavered as Strategy continued its accumulation. It bought coins worth $21 million last week, bringing its holdings to 848,250.
BTC/USD Technical Analysis
Bitcoin has held steady in the past few months. It soared from the July low of $57,783 to a high of $87,200. The pair formed a double-top pattern at 87,200 and a neckline at 83,000, its lowest level on September 28. This pattern often leads to a bearish reversal.
On the positive side, the pair has held steady above the Supertrend indicator and the 50-day moving average. These technicals suggest that Bitcoin is sending mixed signals. A sustained recovery will be confirmed if it moves above the key resistance level of 87,200. Moving above that level will point to more gains to 90,000.
On the other hand, a drop below the 50-day moving average of 80,136 will invalidate the bullish outlook, potentially to 75,000.
Ready to trade our free daily Forex trading signals? We’ve shortlisted the best MT4 crypto brokers in the industry for you.
Crispus Nyaga is a Technical Analyst at DailyForex with more than eight years of experience as a financial analyst, coach, and trader. He specializes in technical analysis of major currency pairs and cryptocurrencies, using chart patterns, trend structure, and key indicators to frame trading scenarios for Forex and digital asset markets. Crispus has worked with well-known brokers including ATFX, easyMarkets, and OctaFX, and his market commentary has been published widely on platforms such as Seeking Alpha, InvestingCube, Capital.com, and Invezz.
As seen on: SeekingAlpha, Macrostreet.com, Invezz.com, Forbes, Investing.com, Marketwatch, Crypto.news