The Forex market is beginning what could be a very big day, with US CPI (inflation) data due. This is usually the most important data point for the most important currency in the market. After a lengthy period where the Australian Dollar lost ground against the greenback, that situation has reversed over recent days, and the price is now approaching what could be a pivotal point at a pivotal moment. This is putting the AUD/USD currency pair in focus. Let’s look at the two currencies.
AUD/USD Fundamental Analysis
The Australian Dollar’s fundamental outlook is mixed, with hawkish RBA policy providing support but global risks limiting its upside. The cash rate stands at 4.60%, and the latest meeting minutes leave further hikes on the table because inflation remains elevated, giving the Aussie a yield advantage over the US Dollar. However, easing Australian consumption and labour-market conditions complicate the case for more tightening. Weak Chinese domestic demand and geopolitical uncertainty remain headwinds. Today’s US CPI and tomorrow’s Australian employment report are the immediate catalysts: softer US inflation or stronger Australian hiring would favour the Aussie, while the opposite combination could reverse its recovery.
The US Dollar’s fundamental outlook remains supported, but its immediate upside has weakened as markets scale back expectations of further Fed tightening. High US Treasury yields and geopolitical uncertainty continue to favour the greenback, although New York Fed President Williams’ view that one more hike this year may suffice—with none needed in 2027—has helped push the Dollar back from its 18-month high. Markets now assign roughly a 79% probability to an October hold. Today’s US CPI report could be pivotal: stronger-than-expected core inflation could revive hike expectations and Dollar demand, while an in-line or softer reading could extend the pullback, particularly after the currency’s substantial recent advance.
It looks like fundamentals and sentiment are supporting a mildly bearish case in this currency pair, albeit more weakly still than they were a few days ago.
AUD/USD Technical Analysis
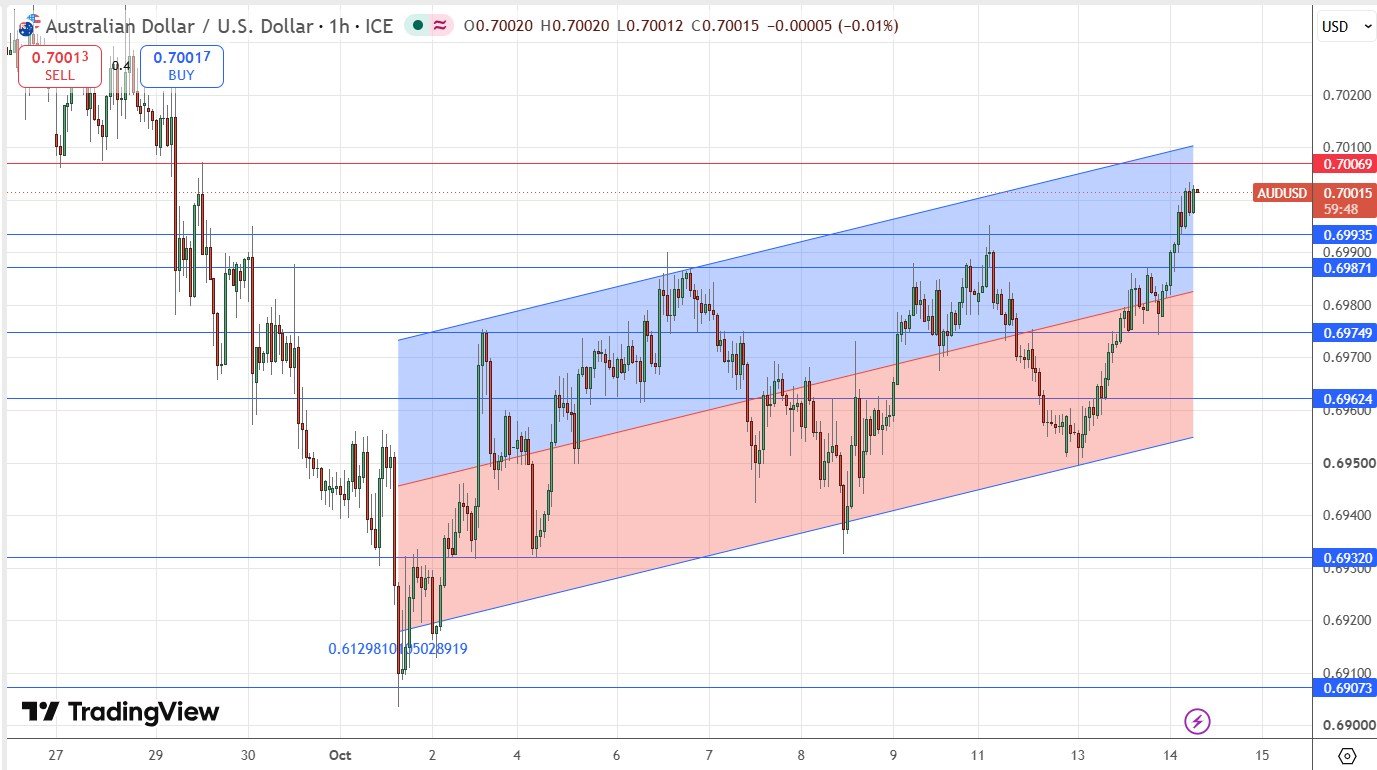
The price chart below shows that the price of this currency pair has been moving slowly higher since the start of October, printing higher highs and higher lows, albeit with gradual and wide swings up. This is evidenced by the linear regression analysis shown over this period which has contained almost all the price action.
The price has now begun to consolidate at a two-week peak just below the round number at 0.7000 and the confluent resistance level just above that. So, we seem to reaching a pivotal level just in time for today’s US CPI data, which could have a major impact upon this currency pair. I think this is likely to be today’s pivotal point, and if the data surprises, we will probably see either a breakout or a major reversal.
I would be comfortable taking a short trade here today from a bearish retest and rejection at 0.7000 / 0.7006 following stronger than expected US CPI data. The surprise would match the underlying fundamentals and shift them more strongly in favour of the US Dollar.
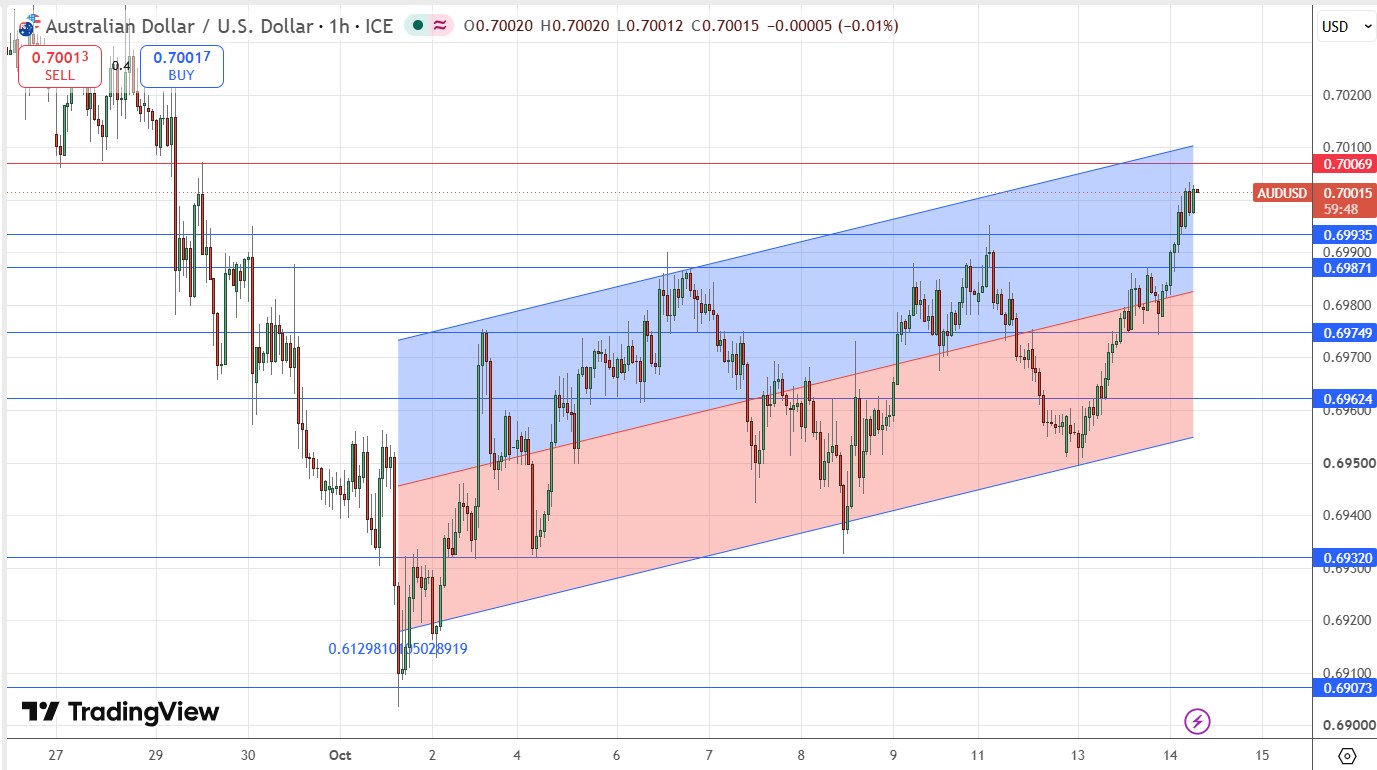
AUD/USD H1 Price Chart – Approaching 0.7000
Support & Resistance Levels
My previous AUD/USD signal on 8th October was not triggered.
Risk 0.25%.
Trades may only be entered prior to 5pm Tokyo time Friday.
Short Trade Idea
-
Short entry following a bearish price action reversal on the H1 time frame immediately upon the next touch of $0.7000, $0.7007, or $0.7042.
-
Place the stop loss 1 pip above the local swing high.
-
Adjust the stop loss to break even once the trade is 20 pips in profit.
-
Take off 50% of the position as profit when the price reaches 20 pips in profit and leave the remainder of the position to ride.
Long Trade Ideas
-
Long entry following a bullish price action reversal on the 1H1 time frame H1H1H1 time frame immediately upon the next touch of $0.6994, $0.6987, or $0.6975.
-
Put the stop loss 1 pip below the local swing low.
-
Move the stop loss to break even once the trade is 20 pips in profit.
-
Remove 50% of the position as profit when the price reaches 20 pips in profit and leave the remainder of the position to ride.
The best method to identify a classic “price action reversal” is for an hourly candle to close, such as a pin bar, a doji, an outside or even just an engulfing candle with a higher close. You can exploit these levels or zones by watching the price action that occurs at the given levels.
Regarding the US Dollar, there will be a release of CPI data at 1:30pm London time. Concerning the Australian Dollar, there will be a release of Employment data at 1:30am.
Ready to trade our daily Forex signals? Here is our list of the best Forex brokers worth checking out.