For years now it felt like the only game in town was U.S. large cap growth stocks.
That’s changed somewhat in the past few years.
Growth stocks have still done fine, of course, what with the AI boom and all. But other areas of the market have come to life. Emerging markets have outperformed. International stocks have staged a comeback.
And this year there are other areas of the market that are beating the S&P 500.
It’s shaping up to be a strange year in the stock market.
Let’s take a look.1
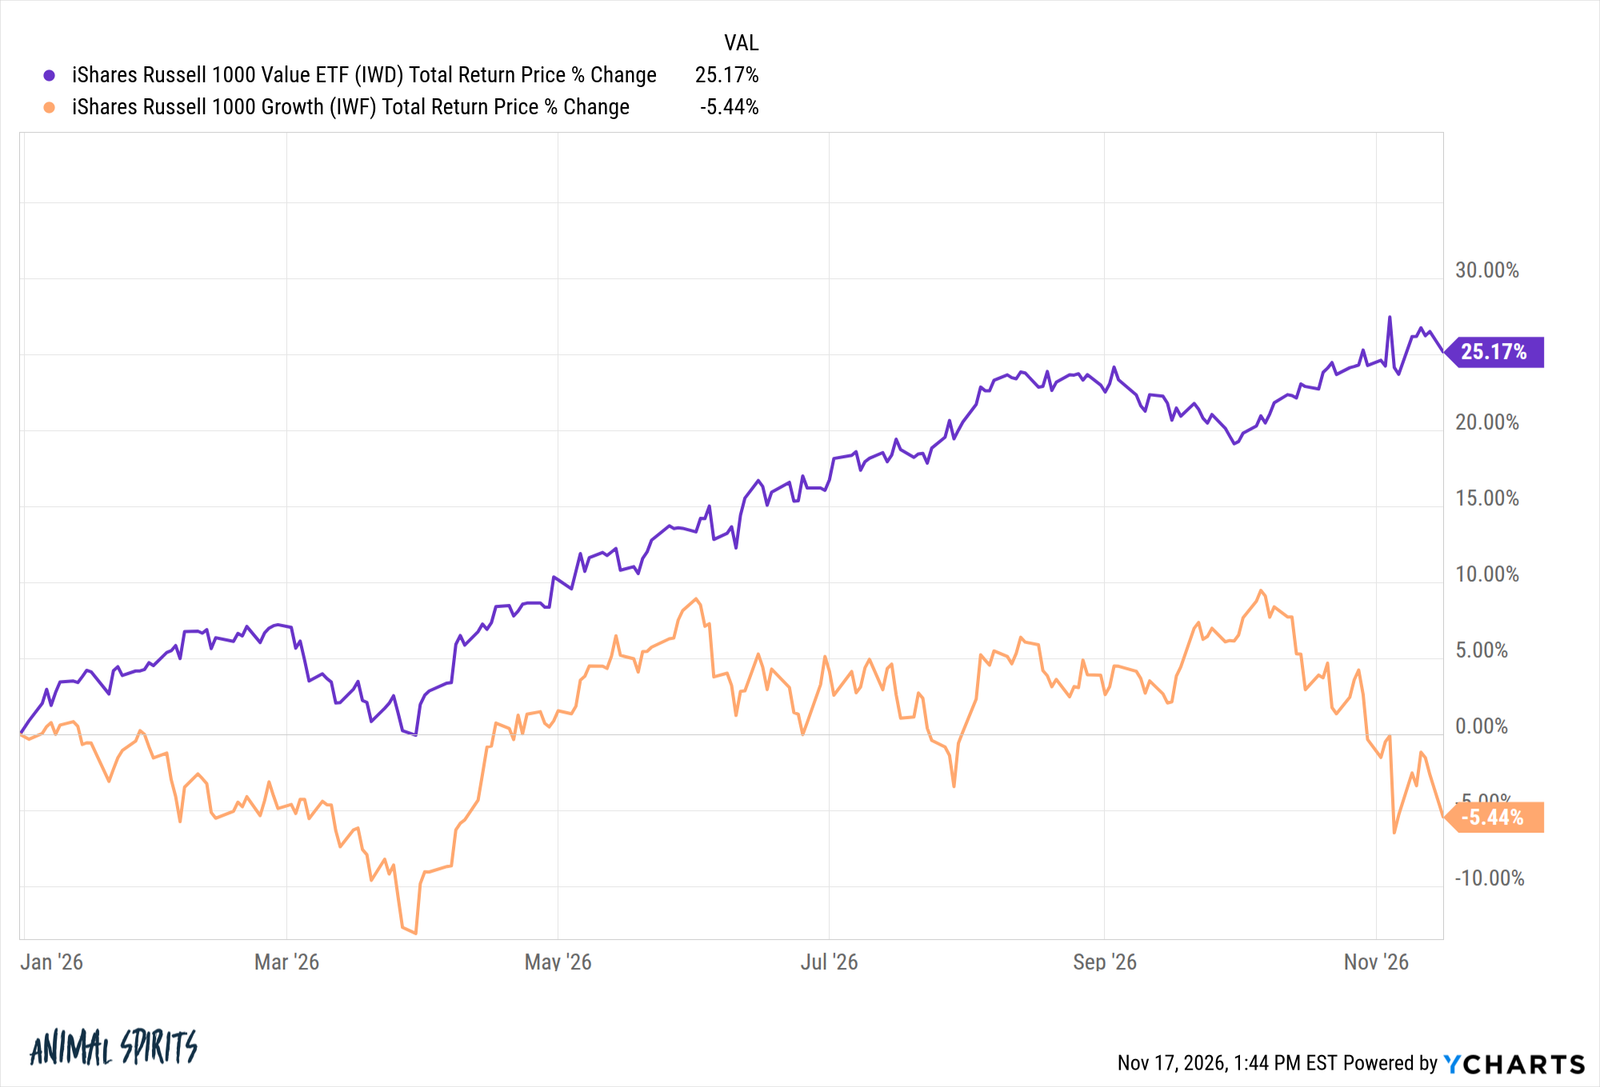
This one is really surprising:
Value stocks are crushing growth stocks this year.
Stocks with lower valuations are finally winning. Maybe value isn’t dead after all.
Small cap value is also outperforming this year, both in the U.S. and in foreign stocks:
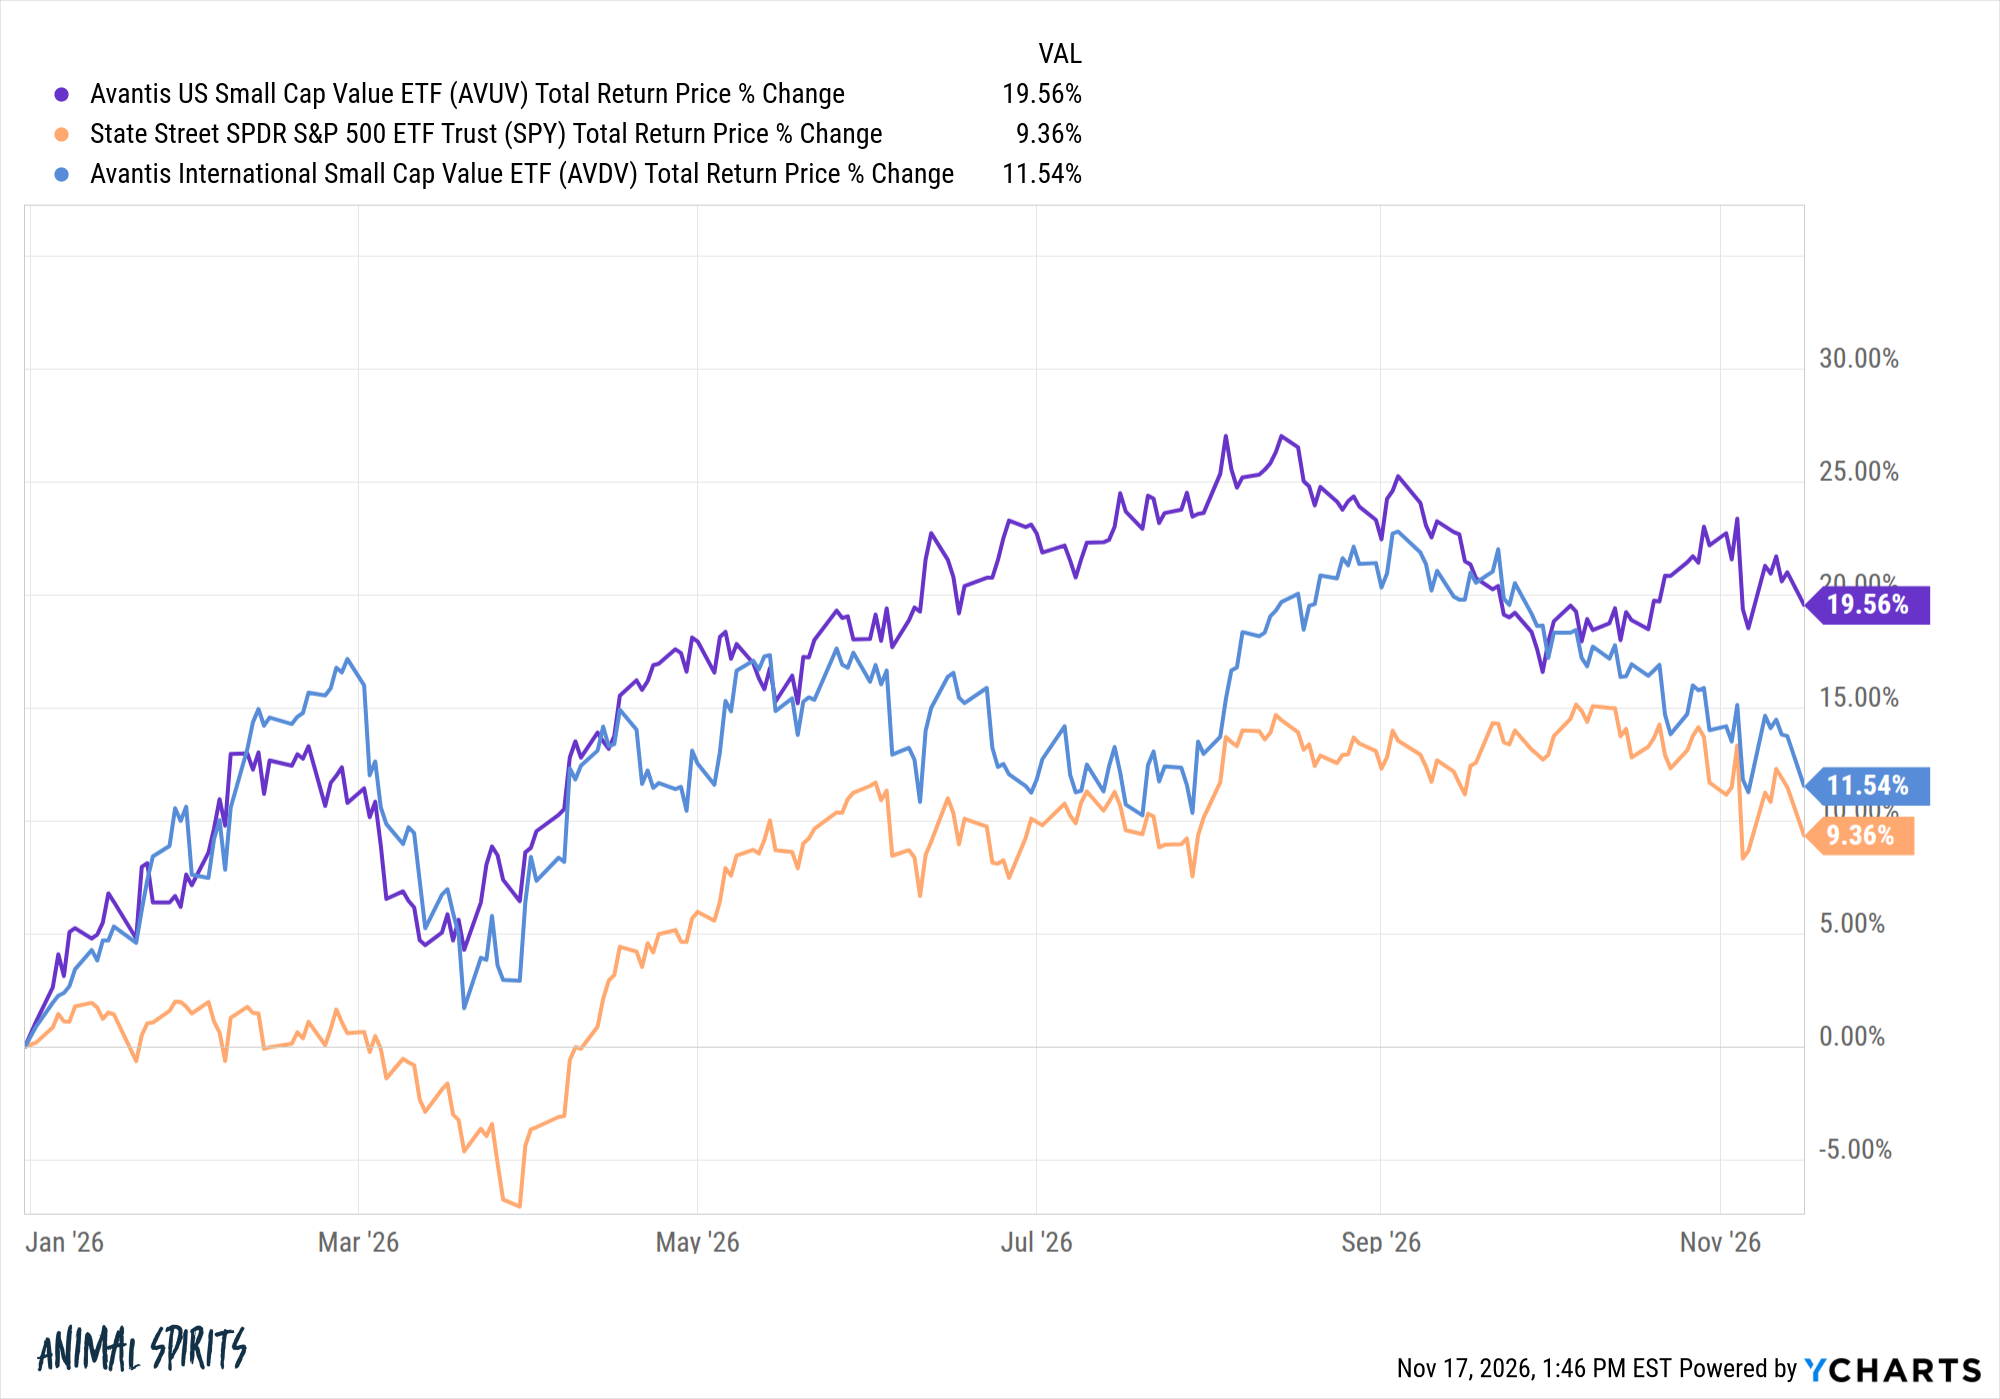
I’m not sure how many people would have assumed small cap value stocks would be winning in a year where hyperscalers are dominating the headlines and investor interest.
The S&P 493 continues to outperform the Mag 7 and overall market this year as well:
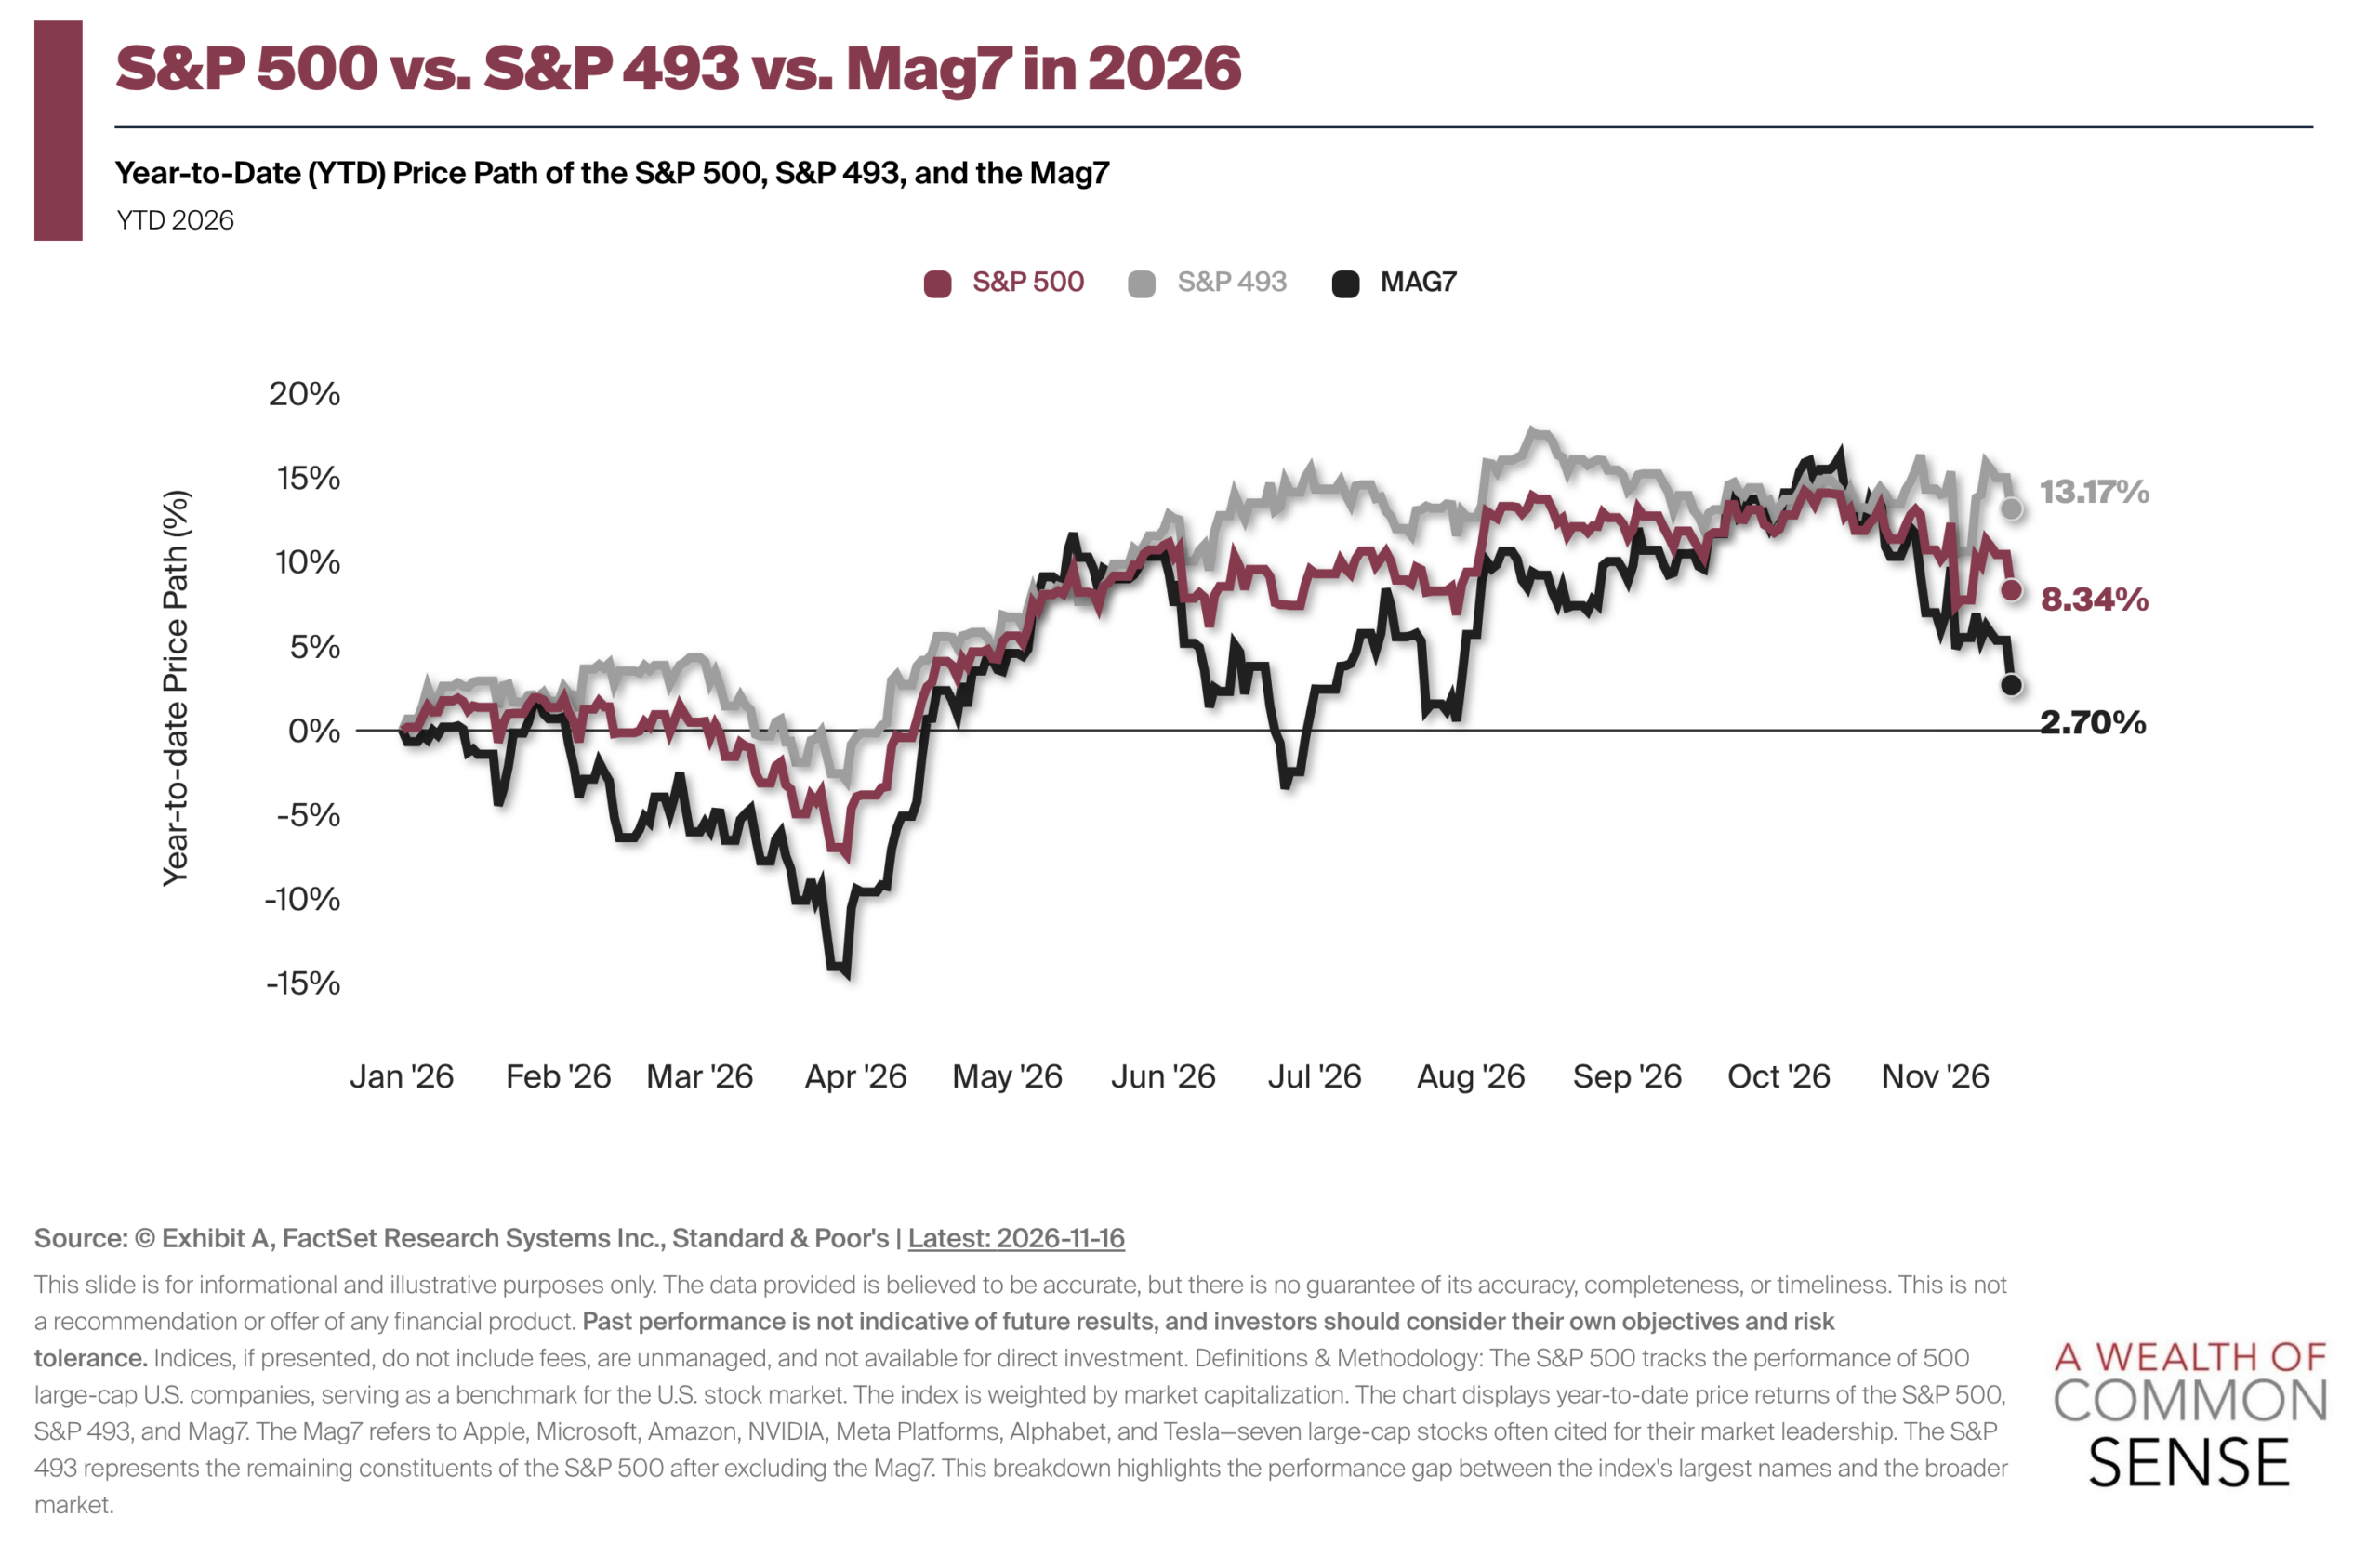
One of the reasons the S&P 493 is outperforming is because it’s not the sexy sectors outperforming this year:
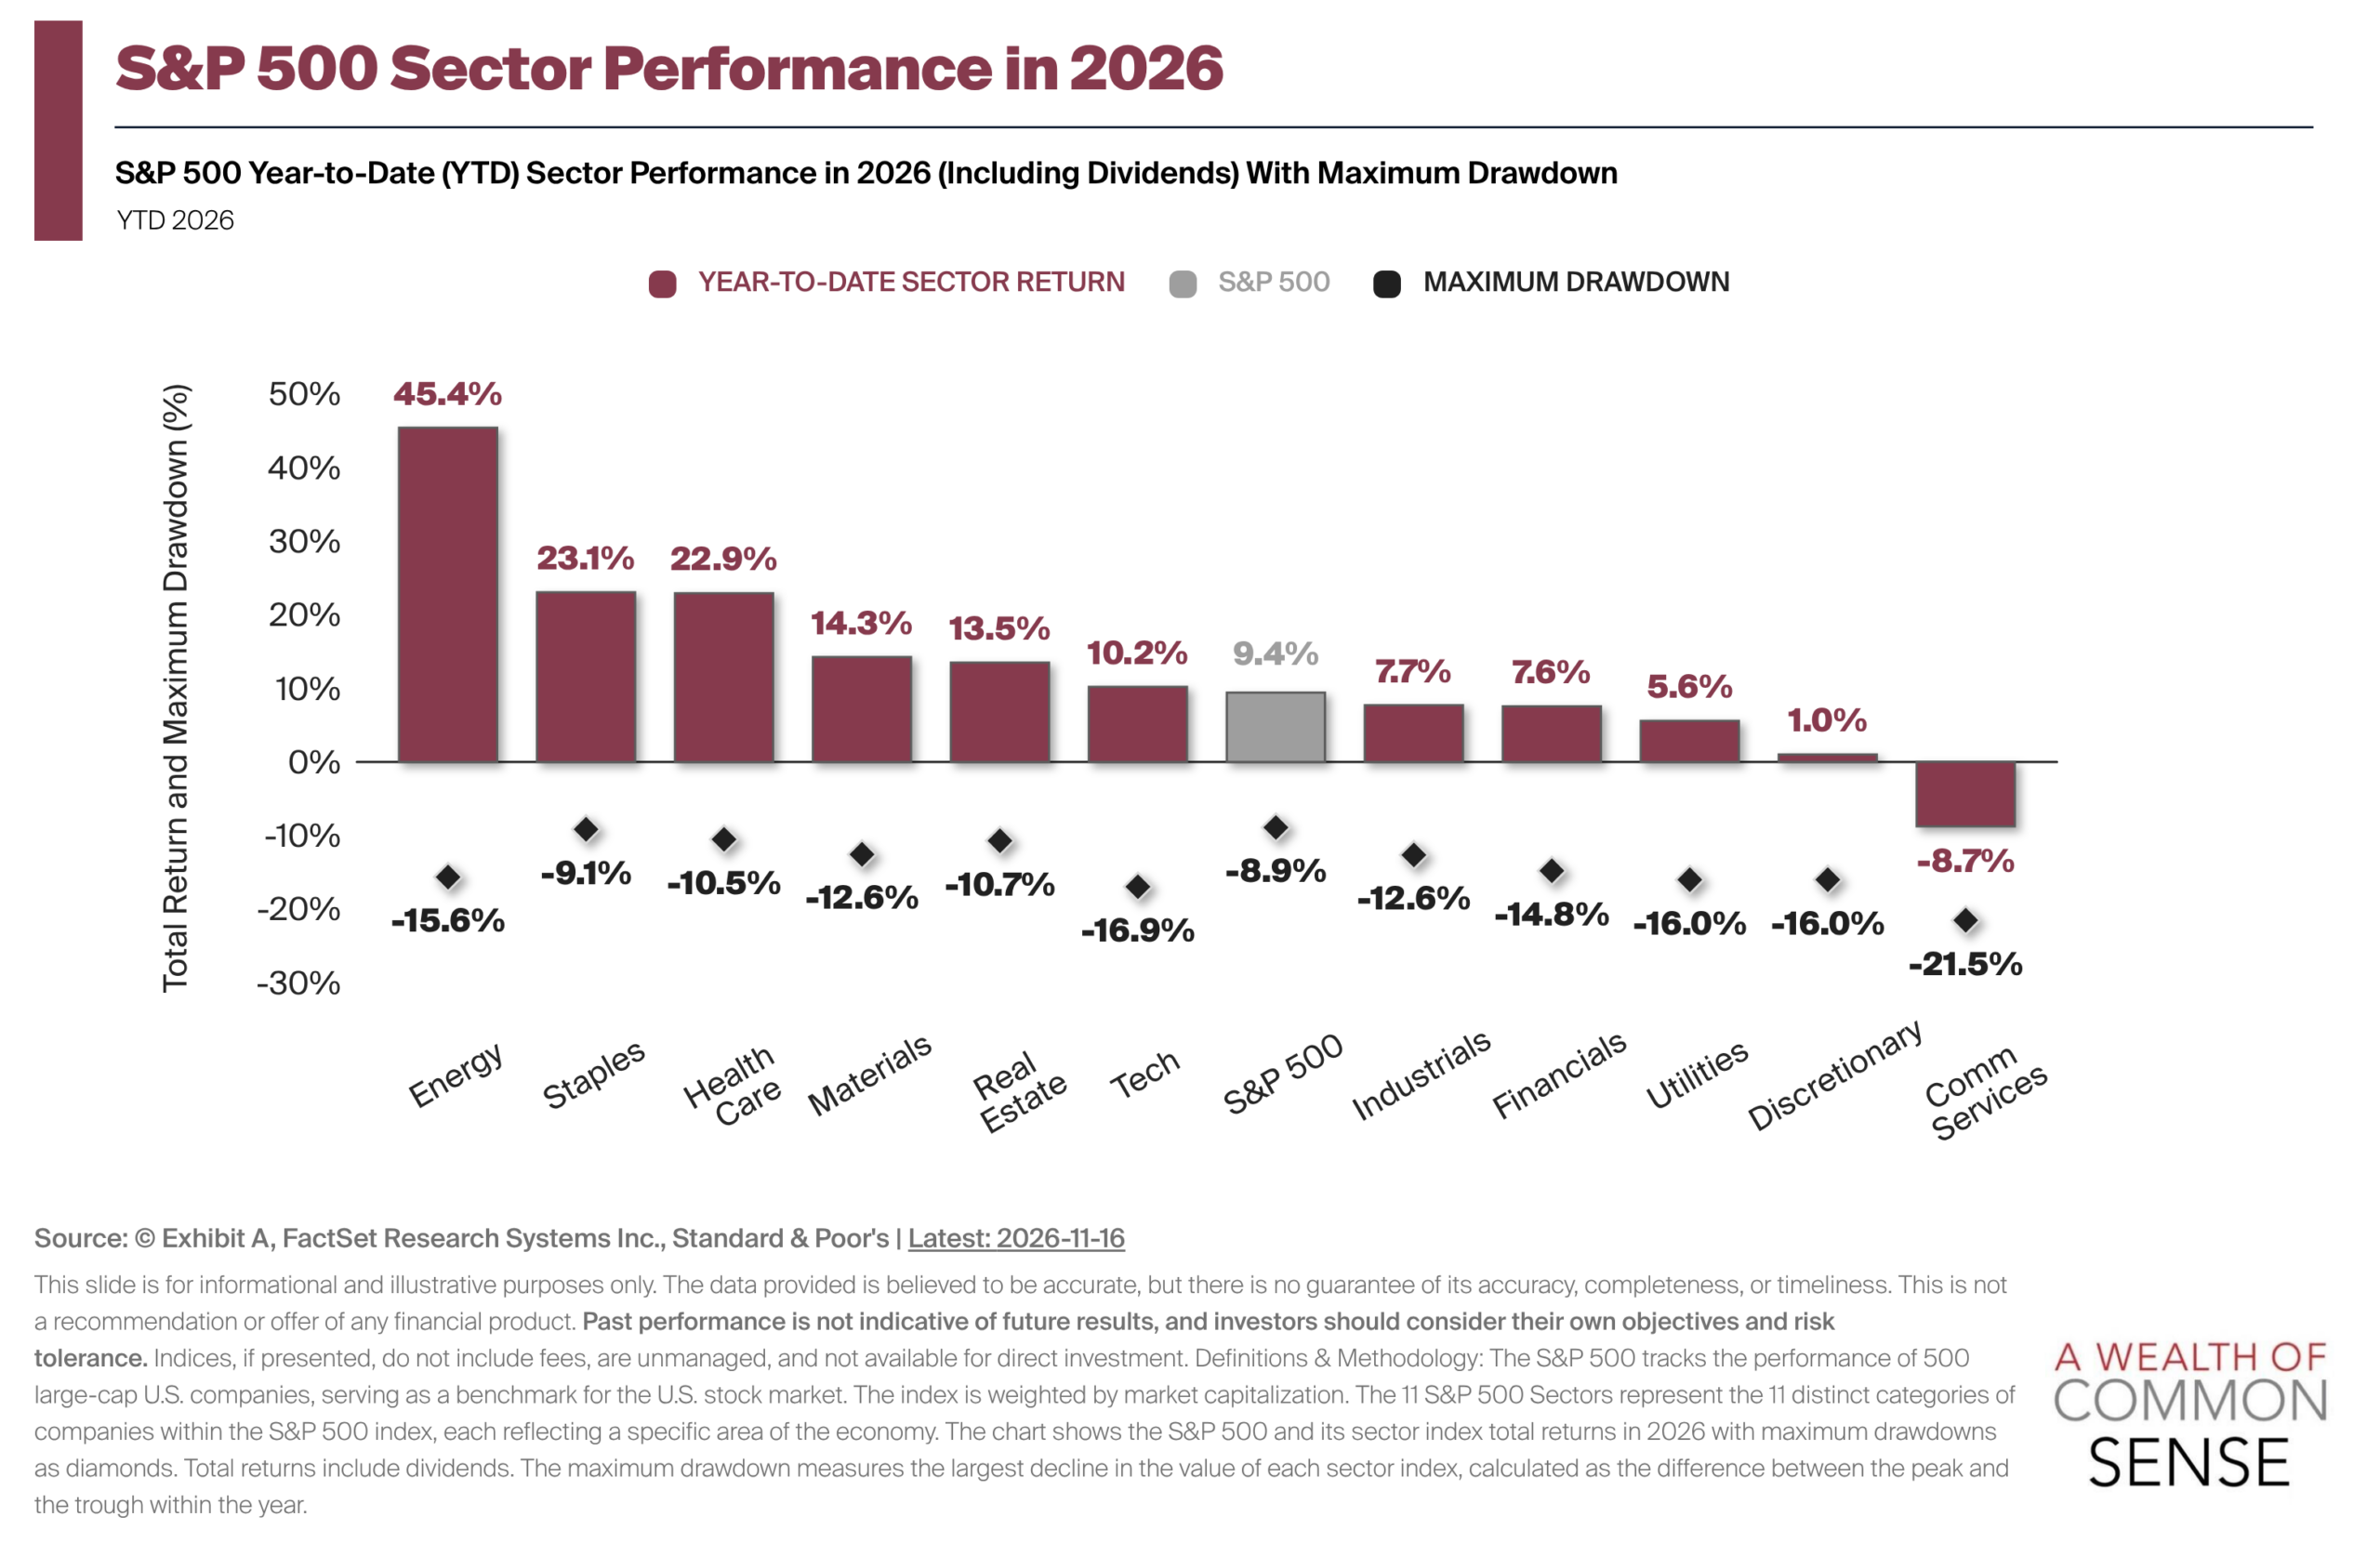
Technology stocks are essentially in line with the market while energy, consumer staples, healthcare, materials and real estate are outperforming the S&P 500.
Duality Research plots the forward PE ratios for every S&P 500 sector on a weekly basis:
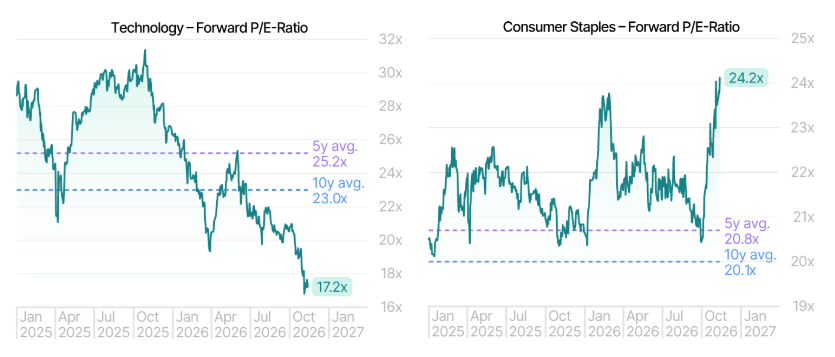
Tech stock valuations have been crashing. Consumer staples have seen valuations explode higher.
Investors either don’t believe in tech earnings going forward or they are so worried about a crash that they’re willing to pay up for more defensive names.2
Of course, things can change in a hurry in this market.
Look at the performance of the iShares Momentum ETF:
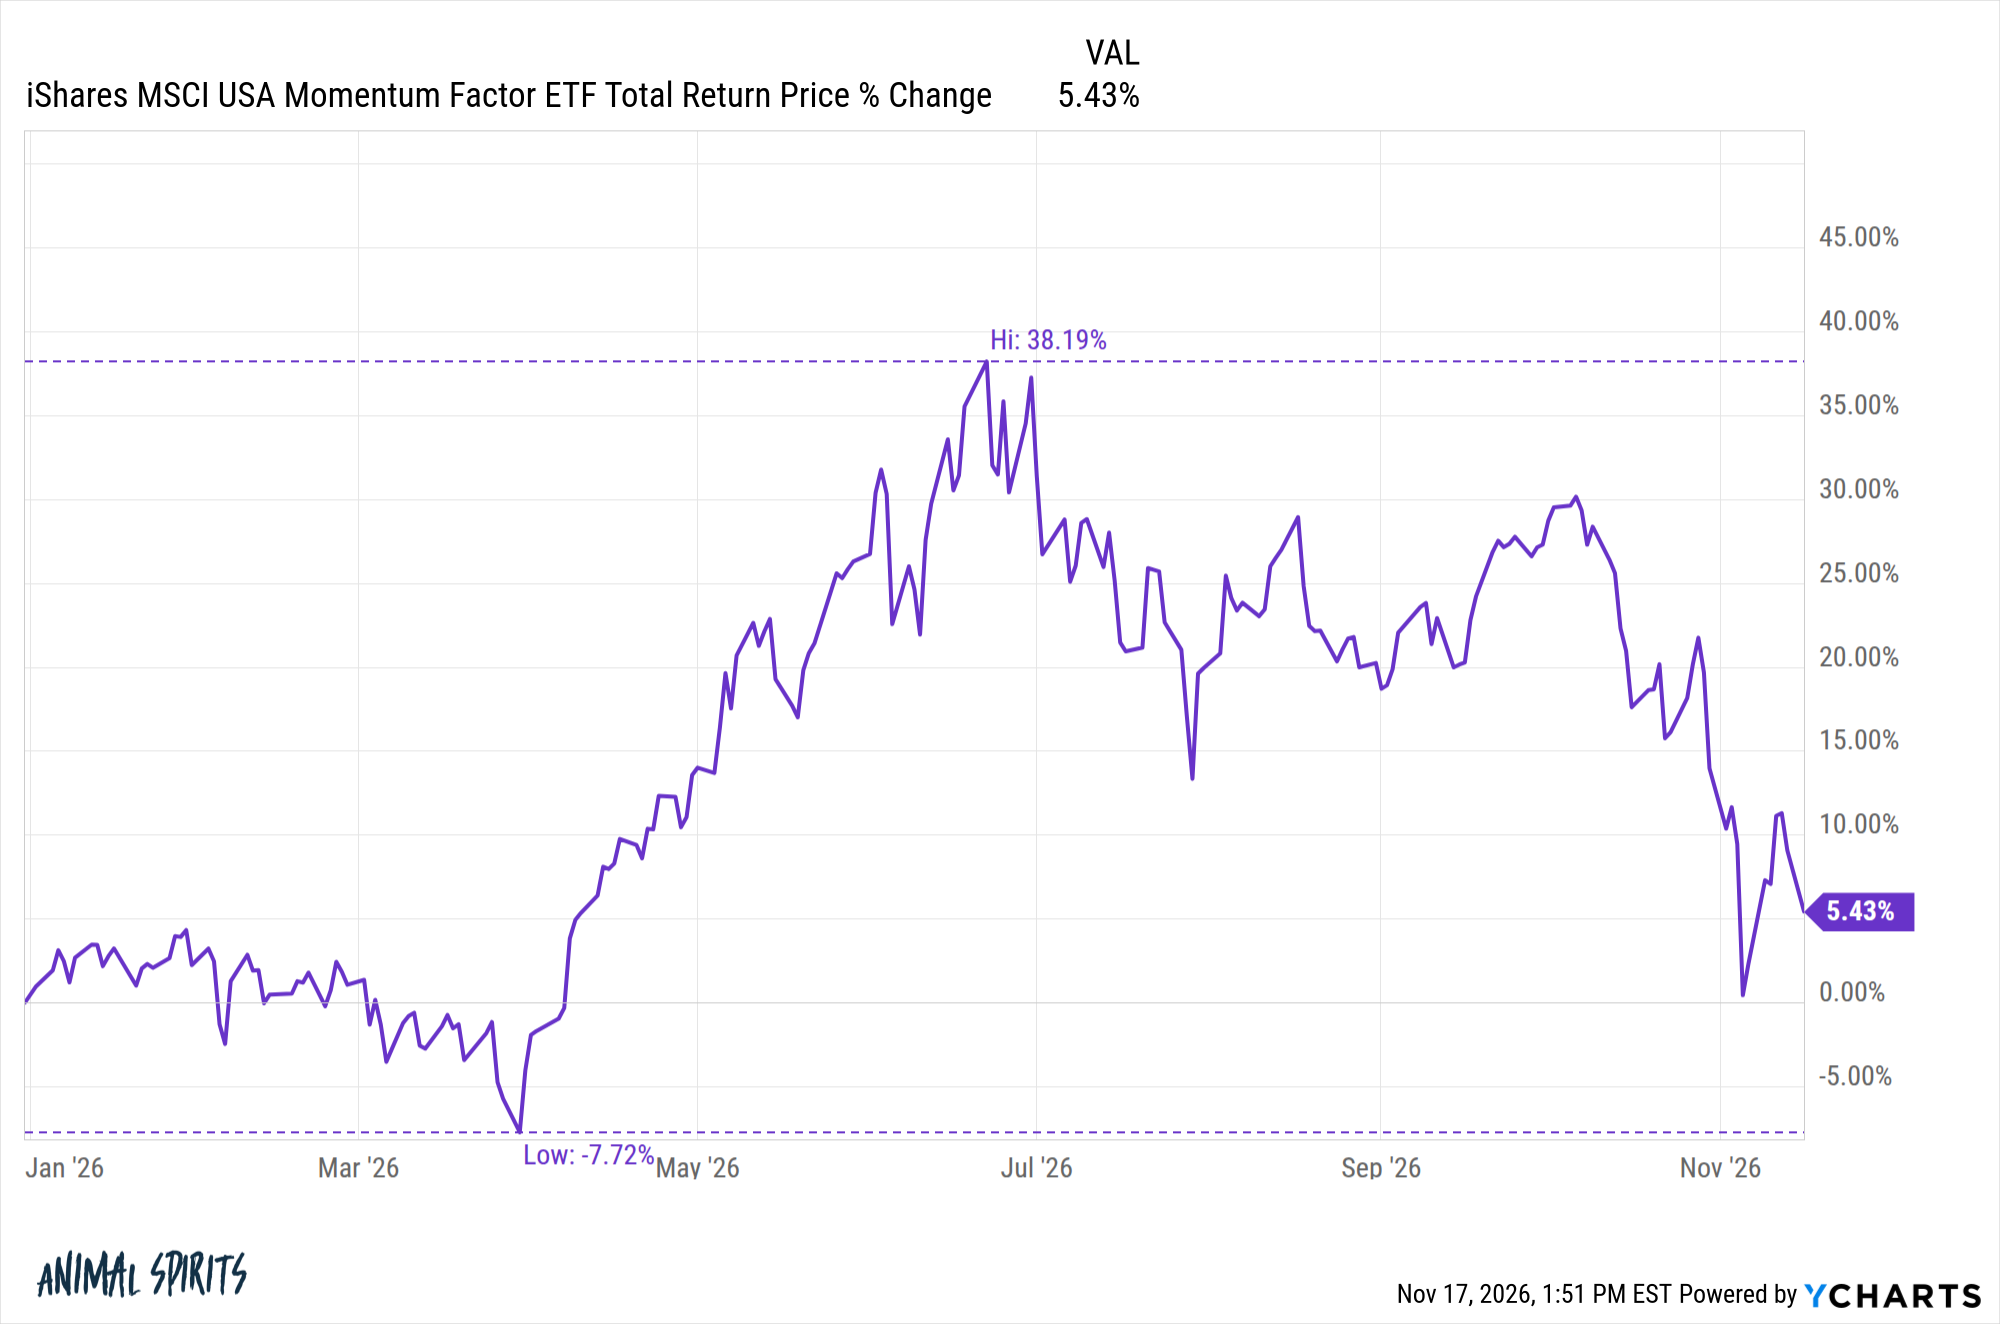
In the spring it was down almost 8% on the year.
A few months later this fund had a gain of almost 40%. Now it’s back down to a 5% year-to-date return following a drawdown of almost 25%.
That’s like a full market cycle in the span of 11 months.
Speaking of momentum stocks — South Korea and Taiwan have both experienced big moves to the upside and downside this year because they are so concentrated in the AI sector.
However, even though both stock markets are in the midst of bear markets at the moment, they still have the highest returns of the country ETFs this year:
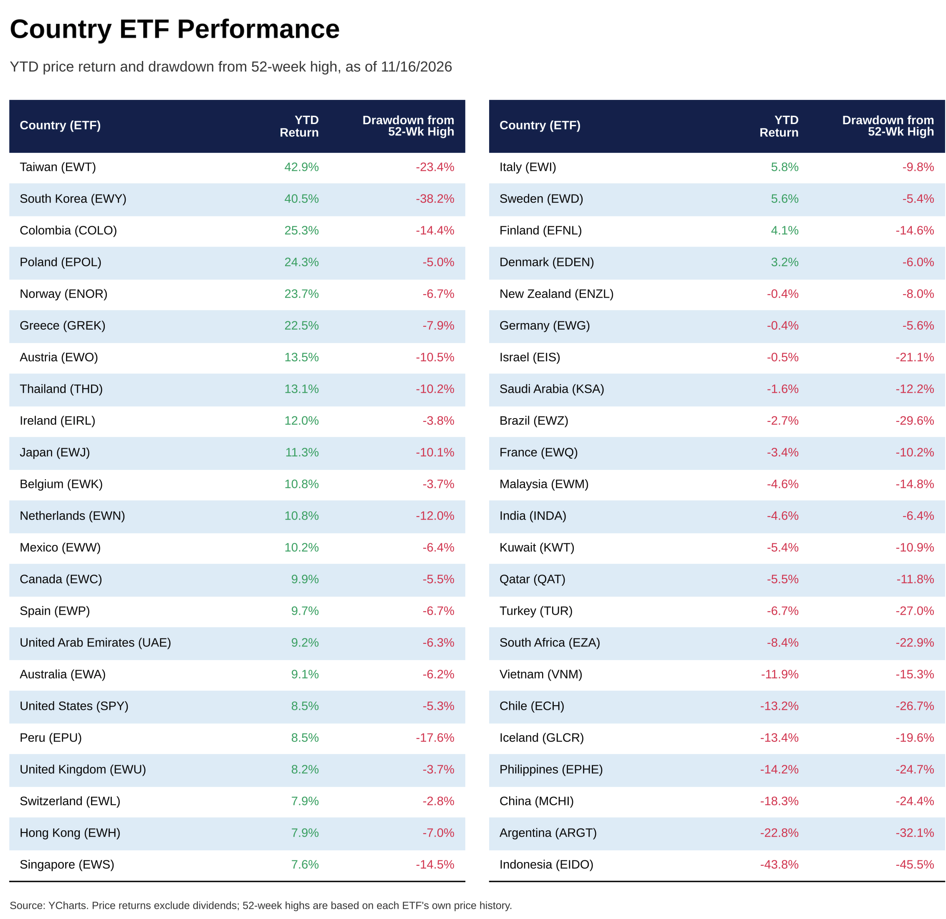
Look at the dispersion between the winners and losers. It’s all over the map.
There are 13 countries with double-digit YTD returns and 7 countries with double-digit YTD losses. Also, 26 out of the 46 country ETFs listed here are currently in a double-digit drawdown from 52-week highs.
Despite all of the crazy headlines, some of the hyperscalers crashing, geopolitics and more, one of the strangest parts about the market this year is the fact that the S&P 500 hasn’t been all that volatile.
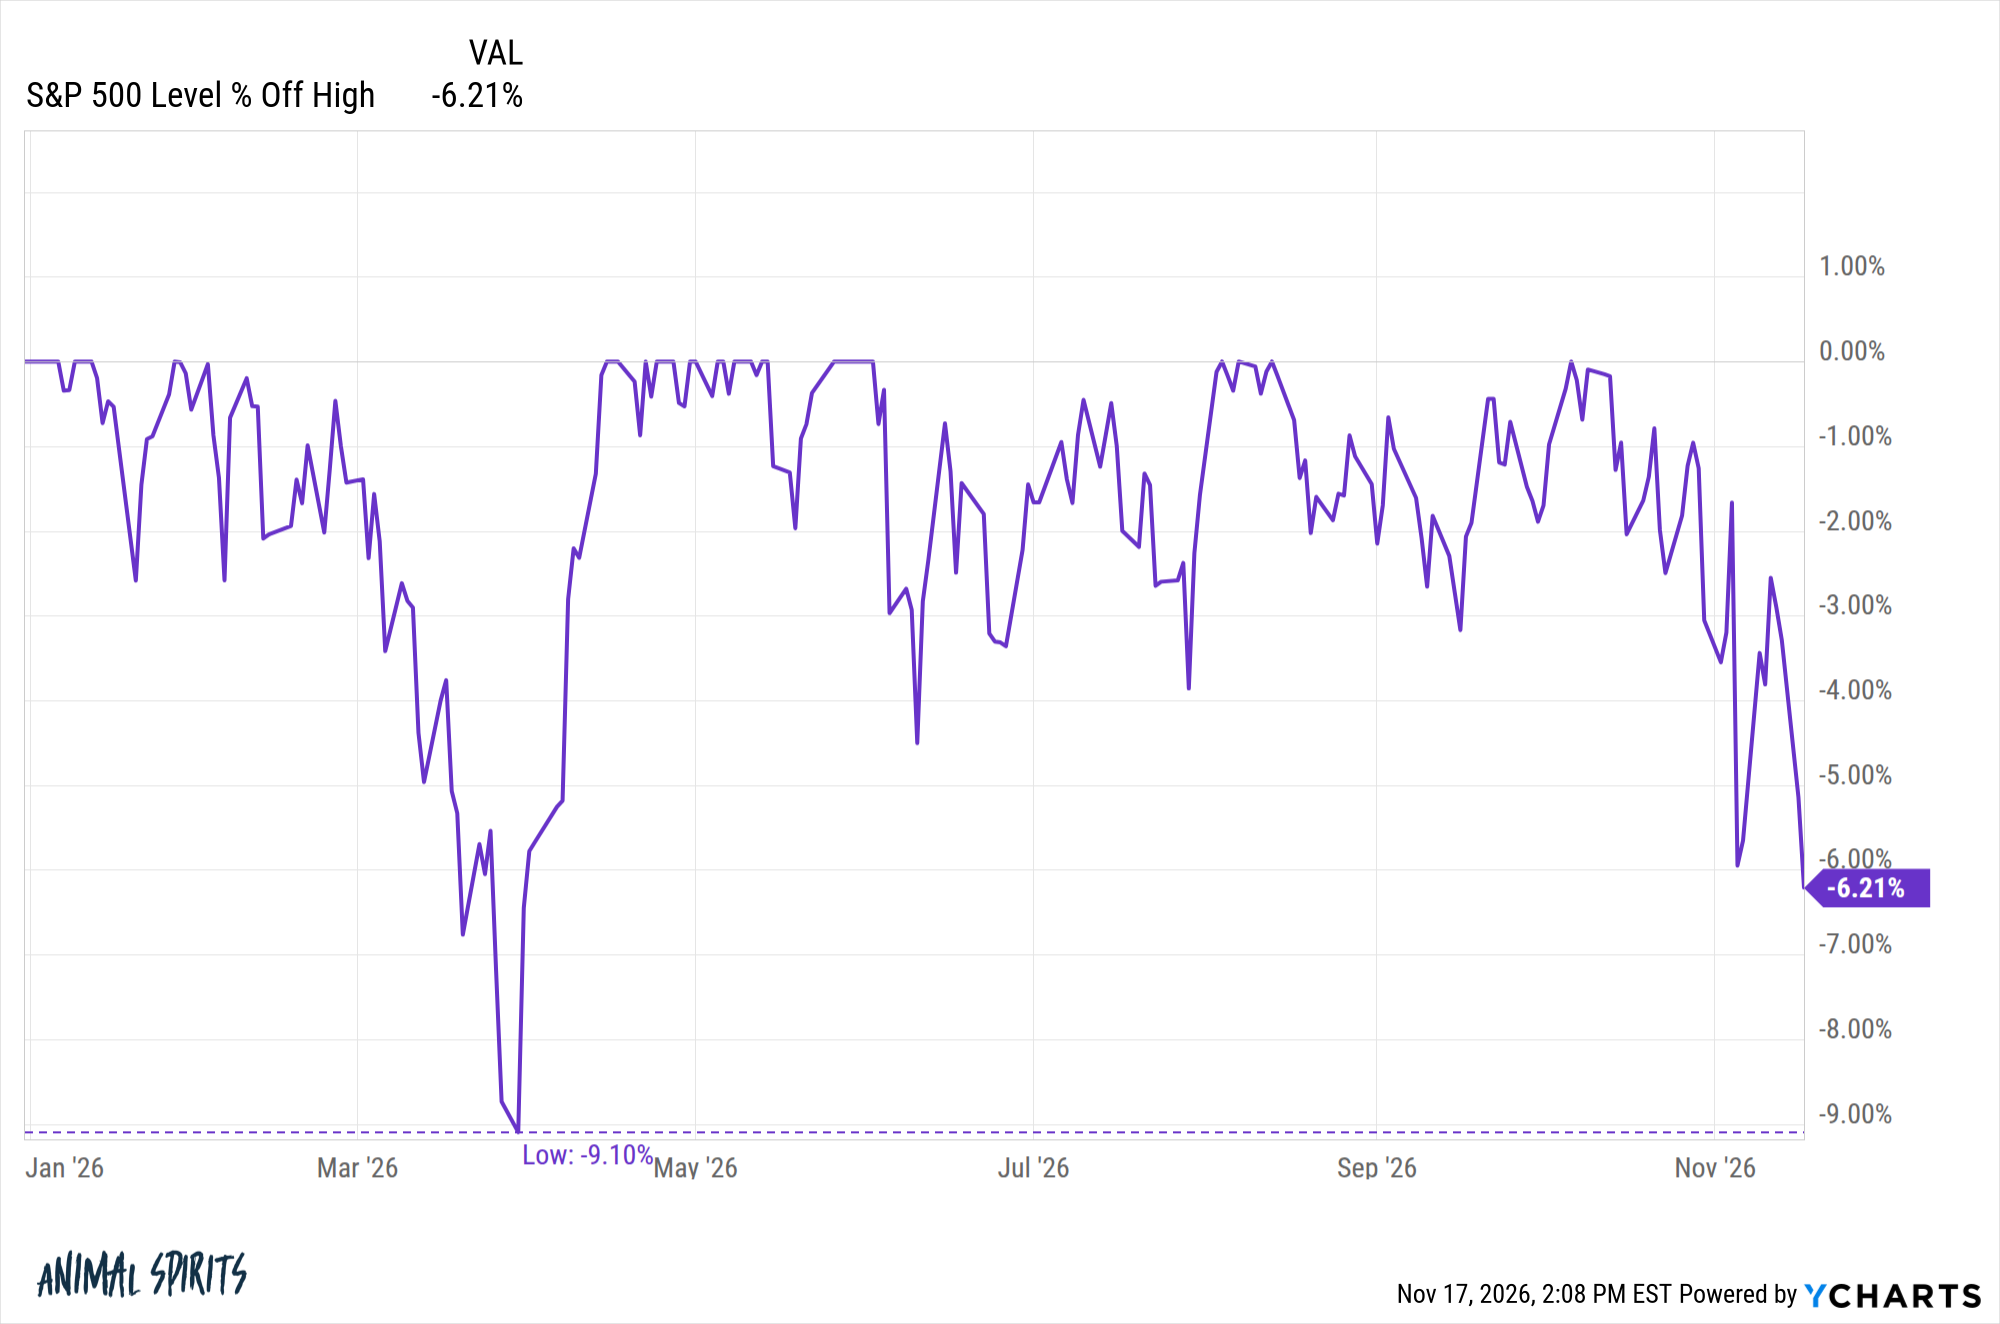
The worst peak-to-trough drawdown came in the spring when it was down 9%. Right now it’s a little more than 6% off the highs.
These losses are tame.
Things can and will get much worse at some point.
That’s what happens with risk assets sometimes.
And sometimes markets don’t act how you think they should.
Further Reading:
This is Why You Need a Plan
1Assume all numbers here are through the close on Monday.
2This also could have something to do with the fact that the tech sector is up 660% in the past 10 years versus gains of 137% for consumer staples.
This content, which contains security-related opinions and/or information, is provided for informational purposes only and should not be relied upon in any manner as professional advice, or an endorsement of any practices, products or services. There can be no guarantees or assurances that the views expressed here will be applicable for any particular facts or circumstances, and should not be relied upon in any manner. You should consult your own advisers as to legal, business, tax, and other related matters concerning any investment.
The commentary in this “post” (including any related blog, podcasts, videos, and social media) reflects the personal opinions, viewpoints, and analyses of the Ritholtz Wealth Management employees providing such comments, and should not be regarded the views of Ritholtz Wealth Management LLC. or its respective affiliates or as a description of advisory services provided by Ritholtz Wealth Management or performance returns of any Ritholtz Wealth Management Investments client.
References to any securities or digital assets, or performance data, are for illustrative purposes only and do not constitute an investment recommendation or offer to provide investment advisory services. Charts and graphs provided within are for informational purposes solely and should not be relied upon when making any investment decision. Past performance is not indicative of future results. The content speaks only as of the date indicated. Any projections, estimates, forecasts, targets, prospects, and/or opinions expressed in these materials are subject to change without notice and may differ or be contrary to opinions expressed by others.
The Compound Media, Inc., an affiliate of Ritholtz Wealth Management, receives payment from various entities for advertisements in affiliated podcasts, blogs and emails. Inclusion of such advertisements does not constitute or imply endorsement, sponsorship or recommendation thereof, or any affiliation therewith, by the Content Creator or by Ritholtz Wealth Management or any of its employees. Investments in securities involve the risk of loss. For additional advertisement disclaimers see here: https://www.ritholtzwealth.com/advertising-disclaimers
Please see disclosures here.