The United States market has shown a positive trend, climbing 2.0% in the last week and rising 12% over the past year, with earnings projected to grow by 18% annually. In such an environment, identifying stocks trading below their intrinsic value can present opportunities for investors seeking to capitalize on potential undervaluation.
Top 10 Undervalued Stocks Based On Cash Flows In The United States
| Name | Current Price | Fair Value (Est) | Discount (Est) |
| Zions Bancorporation National Association (ZION) | $61.92 | $121.76 | 49.1% |
| Textron (TXT) | $73.03 | $142.91 | 48.9% |
| TD SYNNEX (SNX) | $271.52 | $523.23 | 48.1% |
| SouthState Bank (SSB) | $98.91 | $192.39 | 48.6% |
| KeyCorp (KEY) | $19.83 | $39.14 | 49.3% |
| Insteel Industries (IIIN) | $29.59 | $57.31 | 48.4% |
| Chagee Holdings (CHA) | $11.16 | $21.45 | 48% |
| Boston Scientific (BSX) | $41.58 | $79.80 | 47.9% |
| Artisan Partners Asset Management (APAM) | $33.75 | $64.98 | 48.1% |
| Addus HomeCare (ADUS) | $113.27 | $226.18 | 49.9% |
Let’s dive into some prime choices out of the screener.
Overview: Carter’s, Inc., along with its subsidiaries, designs, sources, and markets branded childrenswear both in the United States and internationally, with a market cap of approximately $1.24 billion.
Operations: The company’s revenue segments consist of U.S. Retail generating $1.51 billion, International contributing $445.61 million, and U.S. Wholesale accounting for $1.03 billion.
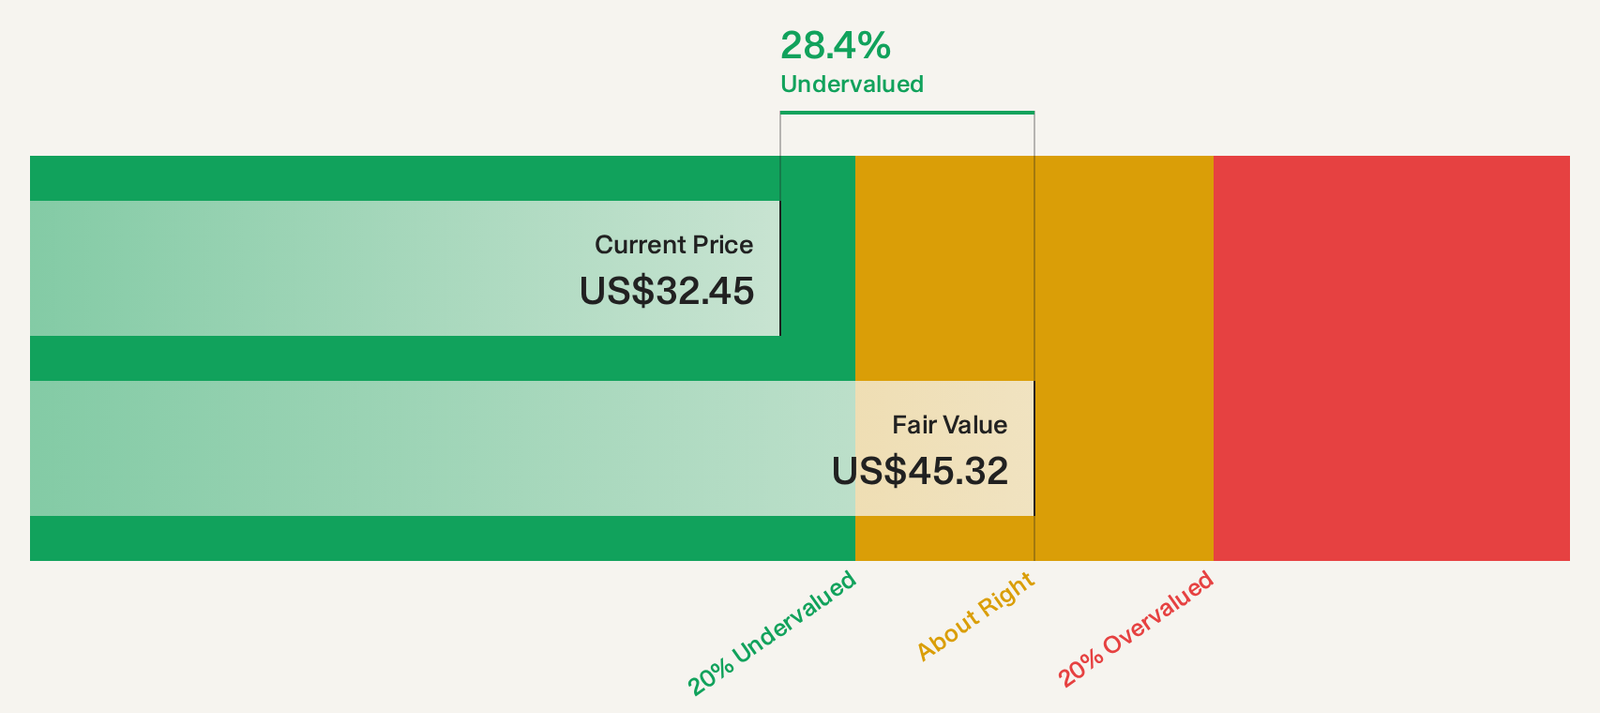
Estimated Discount To Fair Value: 28.4%
Carter’s is trading at a significant discount to its estimated future cash flow value, with shares priced 28.4% below fair value. Despite recent earnings growth of 47%, the company’s revenue is projected to grow more slowly than the US market, and earnings are expected to decline by 17.4% annually over the next three years. Recent product launches and strategic partnerships could enhance brand visibility, but investors should consider potential challenges in sustaining growth momentum amidst broader market conditions.
Overview: Old Republic International Corporation operates through its subsidiaries to offer insurance underwriting and related services in the United States and Canada, with a market capitalization of approximately $9.10 billion.
Operations: Old Republic International’s revenue is primarily derived from Specialty Insurance at $6.10 billion and Title Insurance at $3.08 billion.
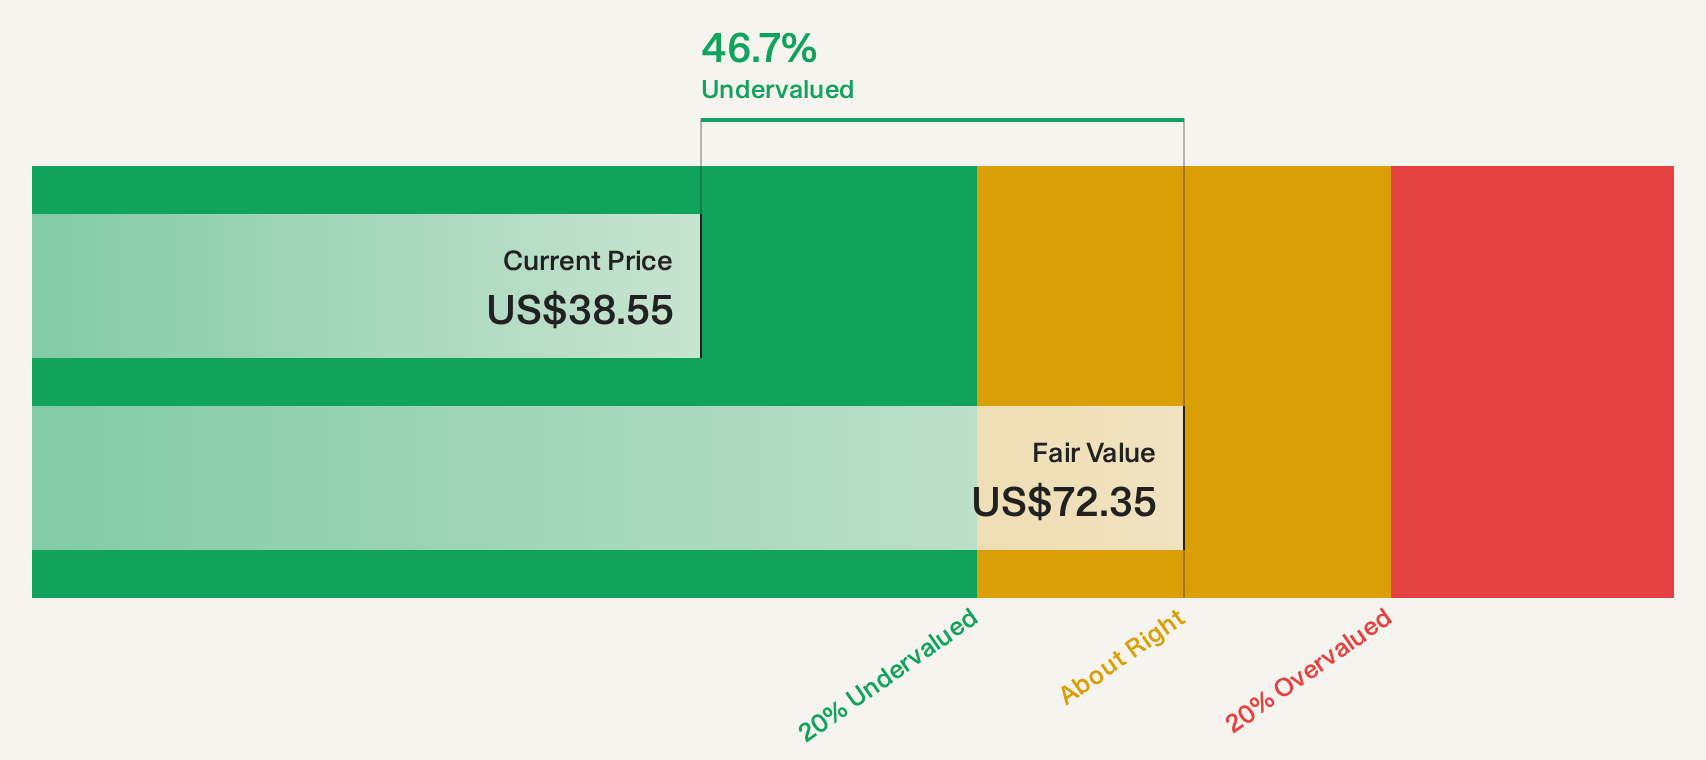
Estimated Discount To Fair Value: 47.9%
Old Republic International is trading at a significant discount, with shares priced 47.9% below its estimated future cash flow value of US$72.35. Despite recent earnings growth of 27.4%, revenue is expected to grow more slowly than the market, and earnings are forecasted to decline by 16.2% annually over the next three years. The company recently increased its dividend and completed a share buyback, but insider selling raises concerns about long-term stability.
Overview: Universal Insurance Holdings, Inc. operates as an integrated insurance holding company in the United States with a market cap of approximately $1.21 billion.
Operations: The company’s revenue primarily comes from its Property & Casualty Insurance segment, which generated $1.63 billion.
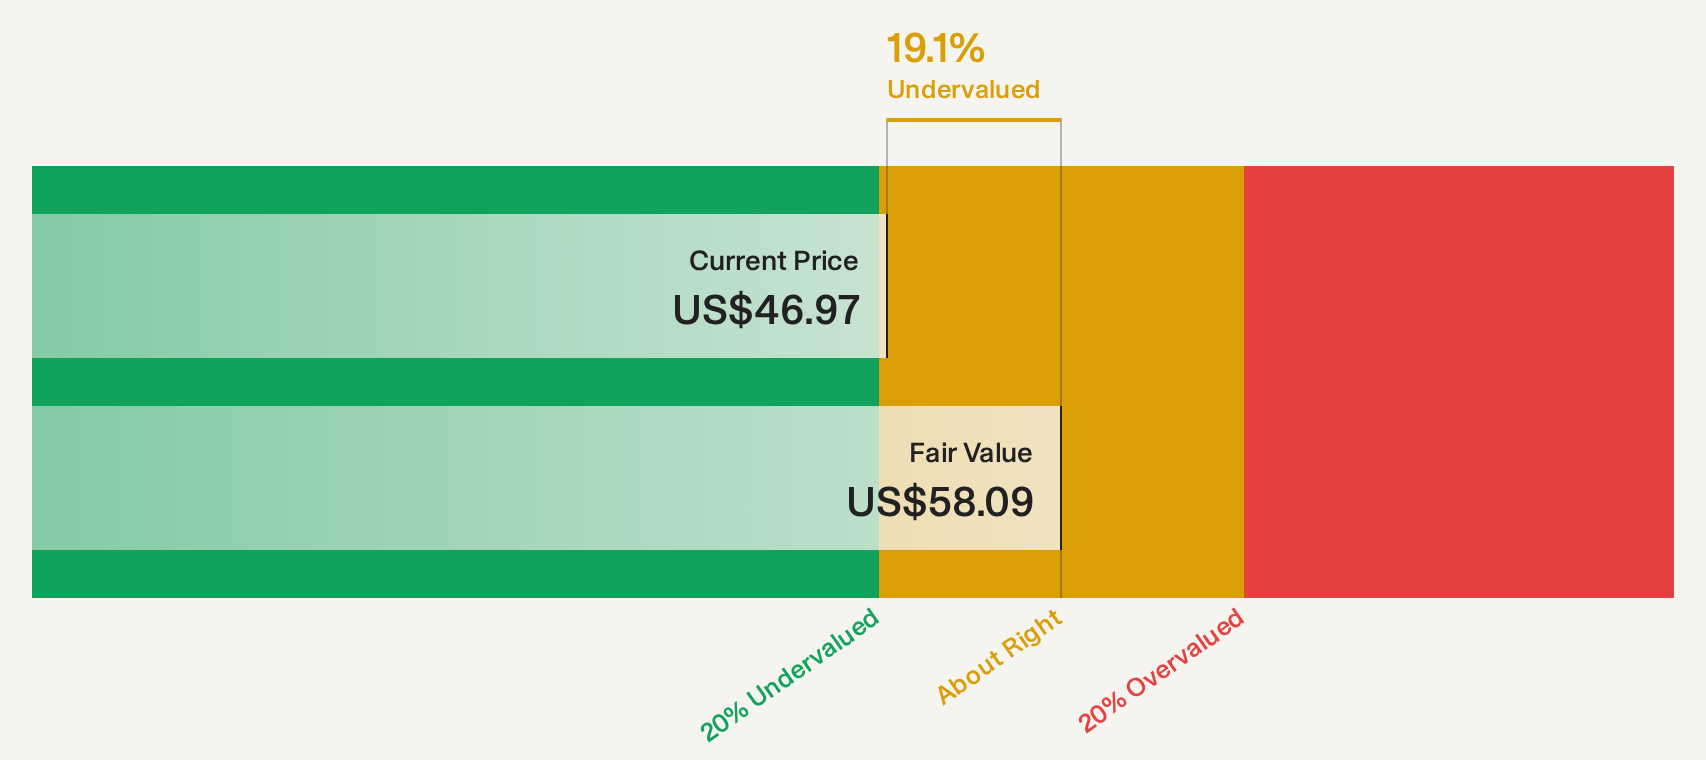
Estimated Discount To Fair Value: 22.1%
Universal Insurance Holdings is trading 22.1% below its estimated fair value, with shares priced at $45.25 against a projected future cash flow value of $58.09. Despite recent earnings growth of 231.3%, forecasts indicate a decline in both revenue and earnings over the next three years, with earnings expected to drop by an average of 32% annually. Recent insider selling and fixed-income offerings may raise concerns, although the company maintains a reliable dividend payout of 1.7%.
Taking Advantage
Curious About Other Options?
This article by Simply Wall St is general in nature. We provide commentary based on historical data
and analyst forecasts only using an unbiased methodology and our articles are not intended to be financial advice.
It does not constitute a recommendation to buy or sell any stock, and does not take account of your objectives, or your
financial situation. We aim to bring you long-term focused analysis driven by fundamental data.
Note that our analysis may not factor in the latest price-sensitive company announcements or qualitative material.
Simply Wall St has no position in any stocks mentioned.
New: AI Stock Screener & Alerts
Our new AI Stock Screener scans the market every day to uncover opportunities.
• Dividend Powerhouses (3%+ Yield)
• Undervalued Small Caps with Insider Buying
• High growth Tech and AI Companies
Or build your own from over 50 metrics.
Have feedback on this article? Concerned about the content? Get in touch with us directly. Alternatively, email editorial-team@simplywallst.com