
Quick overview
- Spot gold (XAU/USD) is trading near $4,021, down about 0.1% after a significant drop earlier in the week.
- Gold is facing bearish pressure below $4,074.59, with a critical support level at $4,000 and a demand zone between $3,961 and $3,893.
- Oil prices have surged to a five-month high, and strong US jobless claims have kept the possibility of a December Fed rate hike alive.
- ETF holdings in gold remain stable, indicating that long-term investors are not selling despite recent price declines.
Quick Answer: Spot gold (XAU/USD) is trading near $4,021 in Friday’s Asian session, October 23, down about 0.1% after Thursday’s 2.45% drop broke the October range. Oil’s jump to a five-month high and strong US jobless claims kept a December Fed hike in play, leaving gold down 3.5% this week and on track for its worst week since June. The level that matters now is $4,000, with the $3,961 to $3,893 demand zone just below.
My view: bearish below $4,074.59, targeting $3,961. A daily close back above $4,074.59 would cancel that call and open $4,224.
Oil and Jobs Data Keep the December Hike Alive
Reuters reported that spot gold eased 0.2% to $4,016.27 by 0351 GMT after touching its lowest level since July 20, while US December gold futures, contracts to buy gold at a fixed price in December, fell 0.7% to $4,030.40. The real damage came on Thursday. Oil rose about 4% to a five-month high after Houthi attacks on Saudi Arabia, and US initial jobless claims, the weekly count of people filing for unemployment benefits for the first time, fell to 194,000, below the 200,000 forecast and the lowest since late July. Fewer claims mean companies are holding on to workers, which gives the Fed room to keep rates high. GivTrade’s Waleed Said told Kitco that “layoffs aren’t picking up, and after PPI at 6.3% that gives the Fed no reason to ease.” PPI is the producer price index, a gauge of wholesale inflation, and “ease” here means cutting interest rates.
The odd part is what happened to rate pricing. Reuters put the odds of a December hike at around 80%, down from 89% on CME FedWatch earlier in the week. FedWatch reads those odds from futures prices, so it shows what traders are betting the Fed will do. The drop came as a Nasdaq slump on AI spending doubts pushed investors into bonds. Gold still fell more than 2%. Lower hike odds would normally help gold, because gold pays no interest and looks more attractive when rates are expected to stay lower. So I read Thursday’s selling as broader de-risking, meaning investors cut risk across their portfolios, on top of the oil shock, although that is my reading rather than a confirmed flow.
Why $4,000 Matters
Capital.com’s Monte Safieddine told Kitco that gold needs to hold $4,000 and called it “a confidence test.” He also warned that the first reaction to geopolitical escalation may be higher crude and higher yields rather than a lasting gold rally, and that is how this week has played out. A weekly close below $4,000, meaning Friday’s final price for the week, would turn this pullback into a breakdown on the weekly chart.
ETF Holders Have Not Sold
According to Heraeus, Bloomberg-tracked holdings in gold ETFs, funds that trade on stock exchanges and hold physical gold for investors, reached a 2026 high of 101.3mn ounces on October 8 and stayed just above 101mn ounces through mid-October. That base has not stopped a decline driven by rate fears, but it suggests longer-term holders are not the ones selling, which is why dips toward $4,000 keep drawing buyers.
What’s Next for Gold
Today brings S&P Global flash PMIs at 13:45 GMT, early surveys of business activity where a reading above 50 signals growth, and the final University of Michigan consumer survey at 14:00 GMT, which shows what households expect inflation to be. Weak activity data could pull December hike odds lower and help gold hold $4,000 into the weekly close. Next week, the Fed decides on October 28 at 18:00 GMT, with PCE data, the Fed’s preferred inflation gauge, also due.
Gold Technical Analysis: $3,961 to $3,893 Demand Zone Is Next
On the daily chart, gold trades at $4,021.21, down 0.08%, after breaking below the $4,074.59 support. The trend is bearish, with price under both moving averages, lines that track the average price over time, at $4,224.02 and $4,283.51. Today’s long lower wick, the thin line under the candle, shows buyers stepped in near $3,986.73.
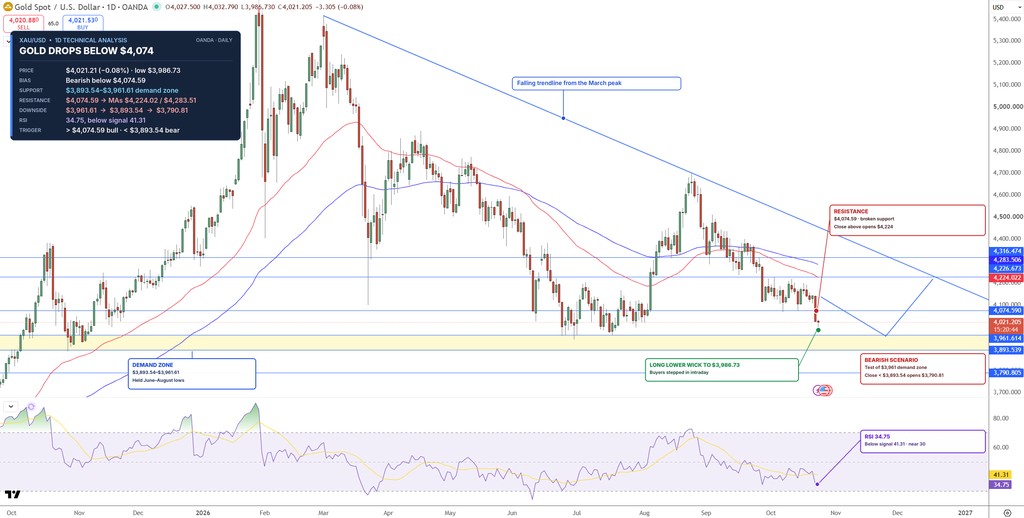
The RSI, a momentum gauge from 0 to 100, reads about 35. Below 50 favors sellers, and near 30 means gold has fallen fast enough that a bounce becomes more likely. Next is the $3,961 to $3,893 demand zone, an area where buyers stepped in before.
I lean bearish below $4,074.59, targeting $3,961, and I expect buyers to defend that zone first. A daily close below $3,893 would open the way for $3,790, while a daily close back above $4,074.59 opens $4,224.
- Resistance: $4,074.59 | $4,224.02 | $4,283.51
- Support: $3,986.73 | $3,961 | $3,893 | $3,790
Thursday’s FXLeaders Live Session
Thursday’s FXLeaders live session covers gold, oil and the US dollar ahead of central bank week, with the key levels to watch.
FAQs
Why is gold down this week?
Oil’s jump to a five-month high and strong US jobless claims revived inflation fears and kept a December Fed hike in play. Gold is down 3.5% this week, its worst week since June.
Will gold hold $4,000?
Buyers stepped in near $3,987 on Friday, but gold stays bearish below $4,074.59. A daily close below $3,893 would open $3,790.
How will the Fed meeting affect gold?
A hold on October 28 is expected, so gold will react to any signal on December. Softer guidance would support gold, while hawkish language would add pressure.

Arslan Ali Butt
Lead Markets Analyst – Multi-Asset (FX, Commodities, Crypto)
Arslan Ali Butt serves as the Lead Commodities and Indices Analyst, bringing a wealth of expertise to the field. With an MBA in Behavioral Finance and active progress towards a Ph.D., Arslan possesses a deep understanding of market dynamics.
His professional journey includes a significant role as a senior analyst at a leading brokerage firm, complementing his extensive experience as a market analyst and day trader. Adept in educating others, Arslan has a commendable track record as an instructor and public speaker.
His incisive analyses, particularly within the realms of cryptocurrency and forex markets, are showcased across esteemed financial publications such as ForexCrunch, InsideBitcoins, and EconomyWatch, solidifying his reputation in the financial community.