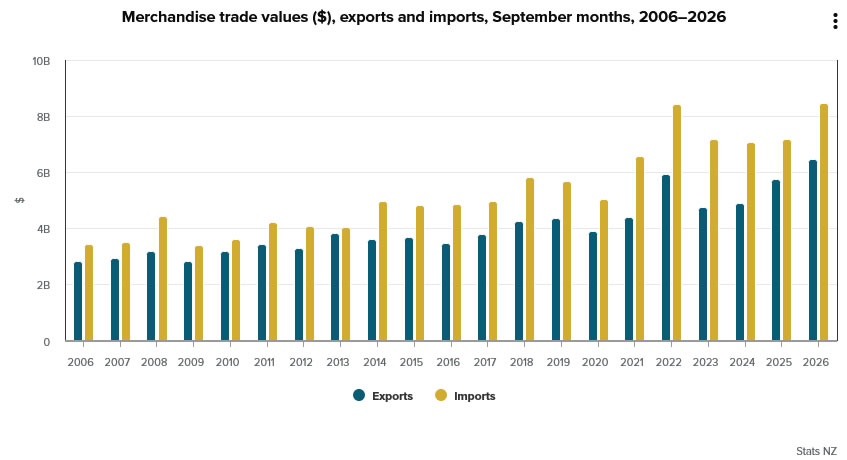
New Zealand’s merchandise trade deficit widened from a revised NZ$1.536B in August to NZ$1.971B in September, substantially exceeding market expectations for a NZ$775M shortfall. The deterioration came despite stronger exports, highlighting the growing pressure from rising import costs. Compared with September 2025, goods exports increased 12%, or NZ$707M, to NZ$6.5B, while imports surged 18%, or NZ$1.3B, to NZ$8.4B, according to Stats NZ.
Petroleum imports were a major driver of the deterioration, jumping 96%, or NZ$608M, from a year earlier. Stats NZ indicated that the increase in fuel import values was predominantly driven by higher prices. Other significant increases included electrical machinery and equipment, up NZ$181M, and mechanical machinery and equipment, up NZ$94M. Meanwhile, exports benefited from higher dairy shipments, with milk powder, butter and cheese exports rising NZ$129M, alongside gains of NZ$127M in meat and edible offal and NZ$85M in aluminium products. However, these improvements were insufficient to offset the much larger increase in imports.
The broader trade position also weakened considerably, with the annual merchandise trade deficit widening from NZ$2.4B to NZ$6.2B in the year ended September 2026. Seasonally adjusted quarterly exports rose 1.2%, while imports increased 2.1%, leaving a NZ$2.0B quarterly deficit. The figures highlight the pressure that elevated energy import costs are placing on New Zealand’s external trade balance, even as export earnings continue to grow. With import values rising faster than exports, stronger overseas sales alone have not been sufficient to prevent a widening trade gap.
Data Summary
Trade Balance
| Indicator | Previous | Current |
|---|---|---|
| Monthly trade balance (NZ$B) | -1.536 | -1.971 |
| Annual trade balance (NZ$B) | -2.4 | -6.2 |
September’s monthly deficit was substantially worse than the NZ$775M consensus forecast.
September Goods Trade — Year-on-Year
| Indicator | Sep Value | Y/Y Change |
|---|---|---|
| Goods exports (NZ$B) | 6.5 | +12% |
| Goods imports (NZ$B) | 8.4 | +18% |
| Petroleum imports (NZ$B) | ~1.2 | +96% |
| Milk powder, butter, cheese exports (NZ$B) | 1.5 | +9.6% |
Quarterly Trade — Seasonally Adjusted
| Indicator | Jun | Sep |
|---|---|---|
| Goods exports (% qoq) | +7.0% | +1.2% |
| Goods imports (% qoq) | +7.6% | +2.1% |
The September quarter recorded a NZ$2.0B trade deficit.
Source: Stats NZ, Overseas Merchandise Trade: September 2026.
Key Takeaways
- Trade deficit substantially exceeds expectations: September’s NZ$1.971B deficit was considerably larger than the NZ$775M consensus and widened from August’s revised NZ$1.536B shortfall.
- Petroleum imports drive much of the annual deterioration: Fuel imports surged 96%, or NZ$608M, year on year. Stats NZ attributed the increase in import values predominantly to higher prices. Petroleum accounted for approximately 47% of the NZ$1.3B increase in total imports.
- Export growth cannot match rising imports: Goods exports increased 12%, supported by dairy, meat and aluminium, but imports grew 18%. Electrical machinery imports rose NZ$181M, while mechanical machinery imports increased NZ$94M.
- Annual trade deficit widens sharply: The deficit for the year ended September expanded from NZ$2.4B to NZ$6.2B. Although annual exports increased NZ$7.4B, imports grew an even larger NZ$11.1B, highlighting sustained pressure on New Zealand’s external trade position.
- Quarterly trade growth moderates: Seasonally adjusted export growth slowed from 7.0% to 1.2%, while import growth eased from 7.6% to 2.1%. Imports nevertheless continued to grow faster than exports, leaving a NZ$2.0B quarterly deficit.