Robinhood’s revenue jumped 51.6% last year, but PayPal trades at a far lower multiple, leaving investors to weigh growth against value.
By Erin Kennedy – Updated
Key Points
-
Robinhood Markets delivered significant revenue growth and high net margins in its most recent fiscal year.
-
PayPal maintains a massive global footprint with over 400 million active accounts and strong free cash flow.
-
Which fintech stock is the better choice for your long-term portfolio?
Choosing between high-growth disruption and established market dominance is a classic investor dilemma. Here is how Robinhood Markets (HOOD -0.75%) and PayPal (PYPL -2.63%) compare for your portfolio heading into 2027.
Robinhood is a mobile-first brokerage catering to a younger generation of traders, while PayPal is a global payments giant used by hundreds of millions of consumers. Both companies are navigating a rapidly changing landscape, balancing regulatory challenges with the need to innovate in digital finance and cryptocurrency trading.
The case for Robinhood Markets
Robinhood Markets operates a financial services platform offering retail brokerage and Bitcoin (BTC -3.67%) trading to nearly 28.6 million funded customers. In its latest annual report, filed for the fiscal year ended 2025, the company highlighted its expansion into Canada and Europe to reach a wider audience. It relies on key partners like Amazon (AMZN -3.87%) for cloud infrastructure to maintain its mobile-first trading environment.
In fiscal 2025, revenue reached close to $4.5 billion, a 51.6% increase over the previous year. The company reported net income of nearly $1.9 billion, achieving a strong net margin of 42.1%. This net margin, which measures the percentage of revenue left after all expenses are paid, reflects the portion of sales kept as profit.
As of Robinhood’s December 2025 balance sheet, the debt-to-equity ratio is approximately 1.3. This ratio compares total debt to shareholder equity to assess financial leverage. The current ratio, which measures a company’s ability to pay short-term obligations with its current assets, is roughly 1.3. Free cash flow, which is the cash a company generates after accounting for capital expenditures, was close to $1.6 billion in fiscal 2025.
The case for PayPal
PayPal provides digital payment tools for roughly 439 million active consumer and merchant accounts across approximately 200 markets. Its offerings include the Venmo digital wallet, peer-to-peer payments, and merchant processing services through partnerships with various financial institutions. The company aims to connect global consumers and businesses through its extensive money-movement ecosystem.
In fiscal 2025, revenue reached nearly $33.2 billion, which was roughly 4.3% higher than the prior year. The company reported net income of close to $5.2 billion, resulting in a net margin of approximately 15.8%. While growth has slowed compared to earlier periods, the company remains a dominant force in the global digital payments landscape.
As of PayPal’s December 2025 balance sheet, the debt-to-equity ratio is roughly 0.5. The current ratio is approximately 1.3, indicating the company has enough liquid assets to cover its short-term liabilities. In fiscal 2025, PayPal generated close to $5.6 billion in free cash flow, providing significant capital for reinvestment or potential shareholder returns.
HOOD & PYPL: Performance Comparison
HOOD – Robinhood Markets
$68.65
–0.75% (–$0.52)

PYPL – PayPal
$56.37
–2.63% (–$1.52)
Key Financial Metrics

HOOD – Robinhood Markets
$68.65
–0.75% (–$0.52)
PYPL – PayPal
$56.37
–2.63% (–$1.52)
Market Cap
$62B
52wk Range
$63.52 – $139.75
Gross Margin
94.81%
P/E Ratio
31.69
EPS (TTM)
$2.17
Dividend & Yield
N/A
Market Cap
$47B
52wk Range
$38.46 – $63.93
Gross Margin
40.81%
P/E Ratio
10.75
EPS (TTM)
$5.24
Dividend & Yield
$0.56 (0.99%)
HOOD – Robinhood Markets
$68.65
–0.75% (–$0.52)
Market Cap
$62B
52wk Range
$63.52 – $139.75
Gross Margin
94.81%
P/E Ratio
31.69
EPS (TTM)
$2.17
Dividend & Yield
N/A
PYPL – PayPal
$56.37
–2.63% (–$1.52)
Market Cap
$47B
52wk Range
$38.46 – $63.93
Gross Margin
40.81%
P/E Ratio
10.75
EPS (TTM)
$5.24
Dividend & Yield
$0.56 (0.99%)
Risk profile comparison
Robinhood Markets faces heavy regulatory and legal scrutiny regarding payment for order flow, a significant revenue source. The company also deals with legal challenges regarding the classification of event contracts and cryptocurrency assets as securities. Market volatility risks also impact interest rate sensitivity, trading volumes, and liquidity management for the platform.
PayPal faces intense global competition from established financial networks such as Visa (V -3.12%) and Mastercard (MA -2.62%). The company is subject to extensive government regulation across multiple countries, including anti-money laundering and lending laws. Additionally, reliance on third-party payment networks and processors means rule changes could increase operating costs or limit services.
Valuation comparison
PayPal appears cheaper than Robinhood based on its forward P/E and P/S ratio, which measures sales over the past 12 months.
| Metric | Robinhood Markets | PayPal |
|---|---|---|
| Forward P/E | 36.9 | 10.6 |
| P/S ratio | 12.2 | 1.4 |
Valuation metrics include sourcing from Financial Modeling Prep (FMP) and may differ from other data providers.
Which stock would I buy for 2027?
These companies are at somewhat different stages in their life cycles. Robinhood was founded less than 15 years ago and went public in 2021. PayPal was established in 2000, went public two years later, got bought by eBay (EBAY -3.49%), and was later spun off. So it makes sense to me that a mature company like PayPal isn’t posting the same level of revenue growth as Robinhood.
That said, let’s go to the tape:
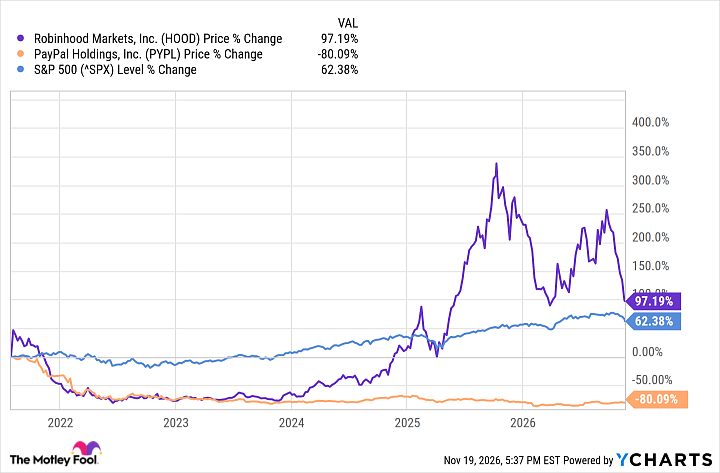
Yikes. Now, past performance is no indication of future results, but PayPal’s stock does not compare favorably to Robinhood’s over the last five years. Investors would be sitting on a loss.
Lest you think I am cherry-picking, here’s PayPal’s return since being spun off from eBay:
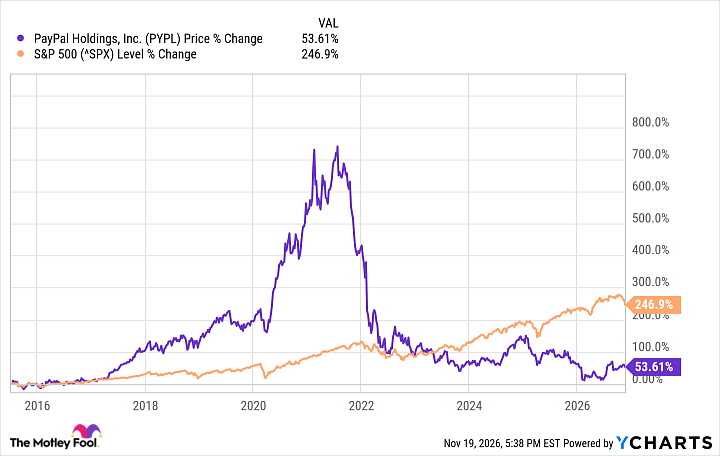
Sure, investors aren’t looking at a loss, but the S&P 500 (^GSPC -2.02%) outperformed the payments specialist by nearly 200 percentage points over that time frame. PayPal stock barely kept pace with inflation.
They say history doesn’t repeat, but it often rhymes. I don’t know that there’s a catalyst that will fire up PayPal. Robinhood is my pick for 2027 and beyond.
Where to invest $1,000 right now
When our analyst team has a stock tip, it can pay to listen. After all, Stock Advisor’s total average return is 790%* — a market-crushing outperformance compared to 202% for the S&P 500.
They just revealed what they believe are the 10 best stocks for investors to buy right now, available when you join Stock Advisor.
*Stock Advisor returns as of November 20, 2026.