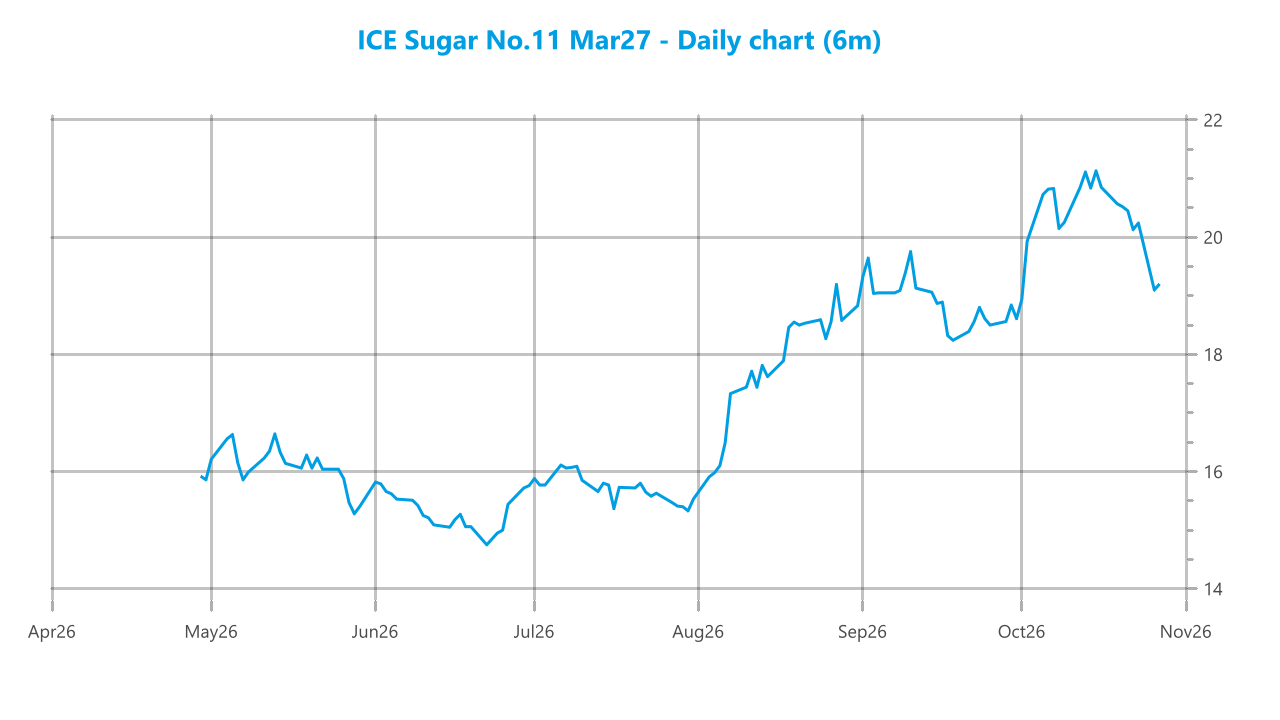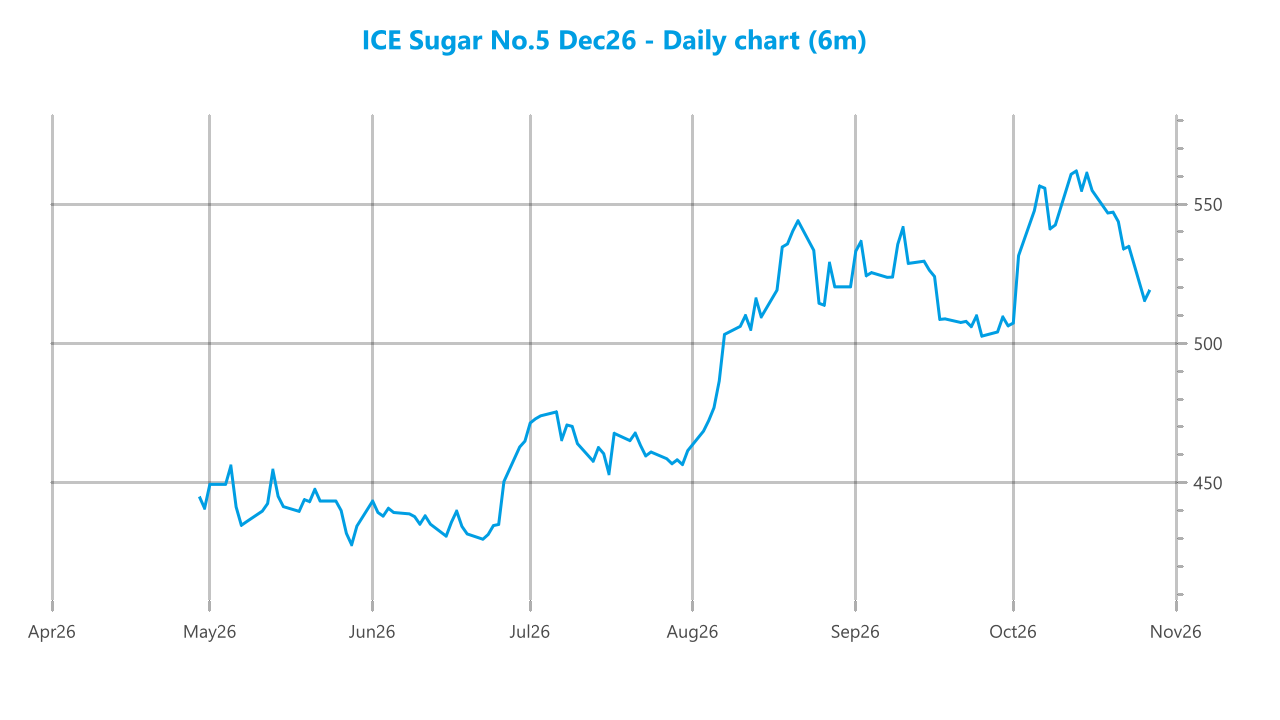
ICE Futures U.S. Sugar No.11 Contract
| Settlement (cUS$/lb) | Open | High | Low | Last | Volume | O/I | Life High | Life Low | |||
|---|---|---|---|---|---|---|---|---|---|---|---|
*Volume includes exchange for physicals.
ICE U.S. Sugar No.11 – Spreads
| Date | Spread | Date | Spread |
|---|---|---|---|
| Mar27 / May27 | 0.53 | Oct27 / Mar28 | -0.26 |
| Mar27 / Jul27 | 0.92 | Oct27 / May28 | 0.85 |
| Mar27 / Oct27 | 1.01 | Mar28 / May28 | 1.11 |
| Mar27 / Mar28 | 0.75 | Mar28 / Jul28 | 1.74 |
| May27 / Jul27 | 0.39 | May28 / Jul28 | 0.63 |
| May27 / Oct27 | 0.48 | May28 / Oct28 | 0.77 |
| Jul27 / Oct27 | 0.09 | Jul28 / Oct28 | 0.14 |
| Jul27 / Mar28 | -0.17 | Jul28 / Mar29 | -0.16 |
ICE Europe White Sugar Futures Contract
| Settlement (US$/mt) | Open | High | Low | Last | Volume | O/I | Life High | Life Low | |||
|---|---|---|---|---|---|---|---|---|---|---|---|
*Volume includes exchange for physicals.
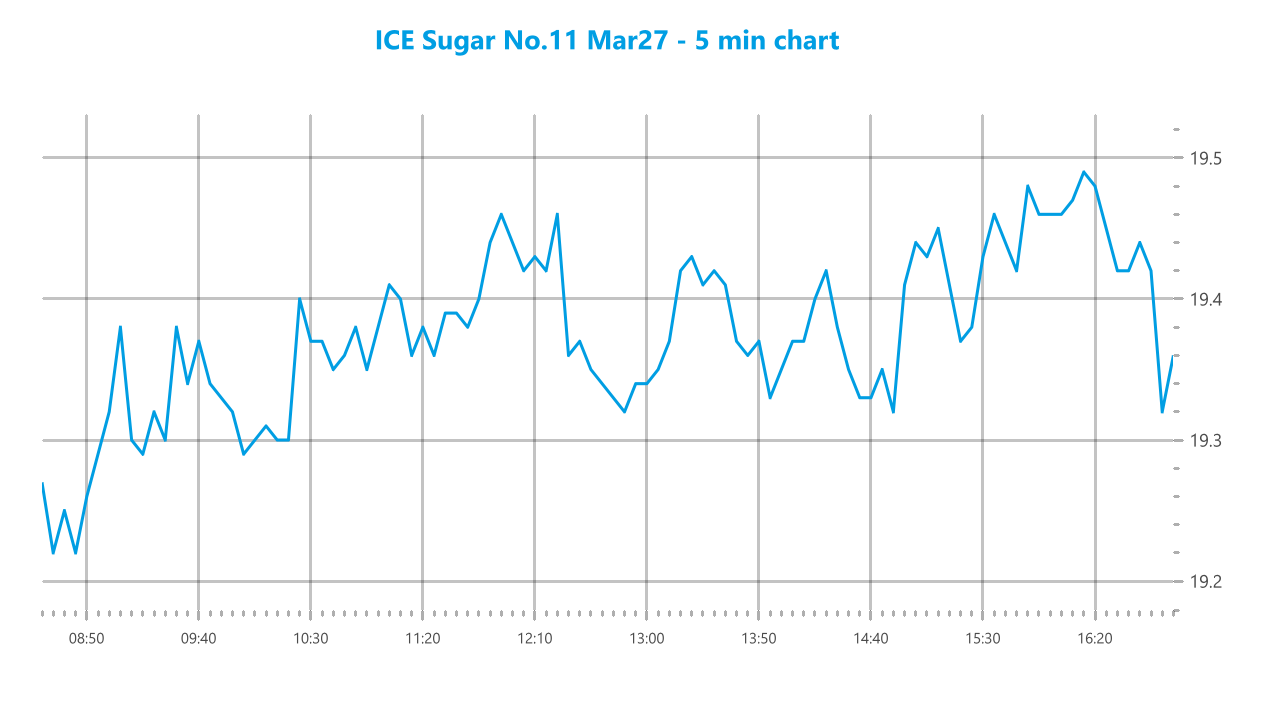
No.11 opened at 19.31 and initially moved lower, with selling pressure taking prices to the session low of 19.20 early in the day. The weakness was short-lived, however, and the market recovered quickly, moving back above the opening level before settling into a choppy but generally firmer pattern. Prices continued to grind higher through the middle of the session, although the advance was repeatedly interrupted by pullbacks and failed attempts to extend gains. After another period of consolidation, renewed buying interest lifted No.11 toward the upper end of the day’s range, eventually reaching the session high of 19.51 during the later part of the session. The rally subsequently lost momentum and prices reversed sharply from the highs, giving back much of the late advance. A modest rebound followed into the close, with No.11 finishing at 19.34, slightly above the opening level and roughly in the middle of the day’s range after a volatile two-way session.
ICE Europe White Sugar – Spreads
| Date | Spread | Date | Spread |
|---|---|---|---|
| Dec26 / Mar27 | -13.00 | Mar27 / May27 | -4.80 |
| Dec26 / May27 | -17.80 | May27 / Aug27 | 5.50 |
| Dec26 / Aug27 | -12.30 | Aug27 / Oct27 | 8.10 |
| Dec26 / Oct27 | -4.20 | Oct27 / Dec27 | 6.30 |
White Sugar Premium
| Date | Premium | Date | Premium |
|---|---|---|---|
| Mar27 / Mar27 | 112.33 | Jul28 / Aug28 | 126.72 |
| May27 / May27 | 128.81 | Oct28 / Oct28 | 120.11 |
| Jul27 / Aug27 | 131.91 | Mar29 / Mar29 | 112.99 |
| Oct27 / Oct27 | 125.79 | May29 / May29 | 121.48 |
| Mar28 / Mar28 | 109.26 | Jul29 / Aug29 | 126.33 |
| May28 / May28 | 124.33 |
*Values calculated basis 5:08 PM.
No.5 opened at 520.10 and initially moved higher, with early buying lifting prices before a quick pullback took the market toward the session low of 518.40. Support emerged at the lower levels and prices recovered through the morning, although trading remained choppy as successive rallies were met by brief bouts of selling. The upward bias became clearer around midday and into the early afternoon, with No.5 progressively establishing higher levels despite several sharp intraday reversals. Buying strengthened later in the session, driving the market toward the upper end of the day’s range and eventually to the 530.70 high. The rally struggled to extend beyond those levels, with potential producer pricing at the higher levels contributing to a loss of momentum. Selling then intensified into the close, prompting a relatively sharp retreat from the highs, although No.5 still finished at 525.70, comfortably above the opening level and preserving a solid gain on the session.